The information provided is of general nature only and does not take into account your personal objectives, financial situations or needs. Before acting on any information provided, you should consider whether the information is suitable for you and your personal circumstances and if necessary, seek appropriate professional advice. All opinions, conclusions, forecasts or recommendations are reasonably held at the time of compilation but are subject to change without notice. Past performance is not an indication of future performance. Go Markets Pty Ltd, ABN 85 081 864 039, AFSL 254963 is a CFD issuer, and trading carries significant risks and is not suitable for everyone. You do not own or have any interest in the rights to the underlying assets. You should consider the appropriateness by reviewing our TMD, FSG, PDS and other CFD legal documents to ensure you understand the risks before you invest in CFDs. These documents are available here.
Any references to Australian or international shares, sectors, indices, ETFs, crypto-related stocks or other instruments are provided for market commentary and watchlist purposes only and do not constitute a recommendation, offer or solicitation to buy, sell or hold any financial product or adopt any investment strategy. International markets may involve additional risks, including currency fluctuations, regulatory differences, market structure differences, reduced liquidity and higher volatility. Company-specific, sector-specific and macroeconomic risks may also affect performance.
Commentary on geopolitical developments, economic data, central bank decisions, earnings, policy changes and other global or financial market events is based on information available at the time of publication and may change without notice. Such events can lead to sudden market moves, price gaps, reduced liquidity, wider spreads and increased volatility, particularly in leveraged products such as CFDs. Forward-looking statements, expectations and scenario analysis are inherently uncertain and should not be relied on as guarantees of future market behaviour or outcomes.
Dow Jones Industrial Average drops for a fifth day as AI rout widens

- DJIA falls for a fifth straight session to its lowest since April, near 48,000.
- Reuters says the SEC is examining Nvidia's accounting, and Anthropic sinks.
- US core PCE and third-quarter GDP land Wednesday, a day before Thanksgiving.
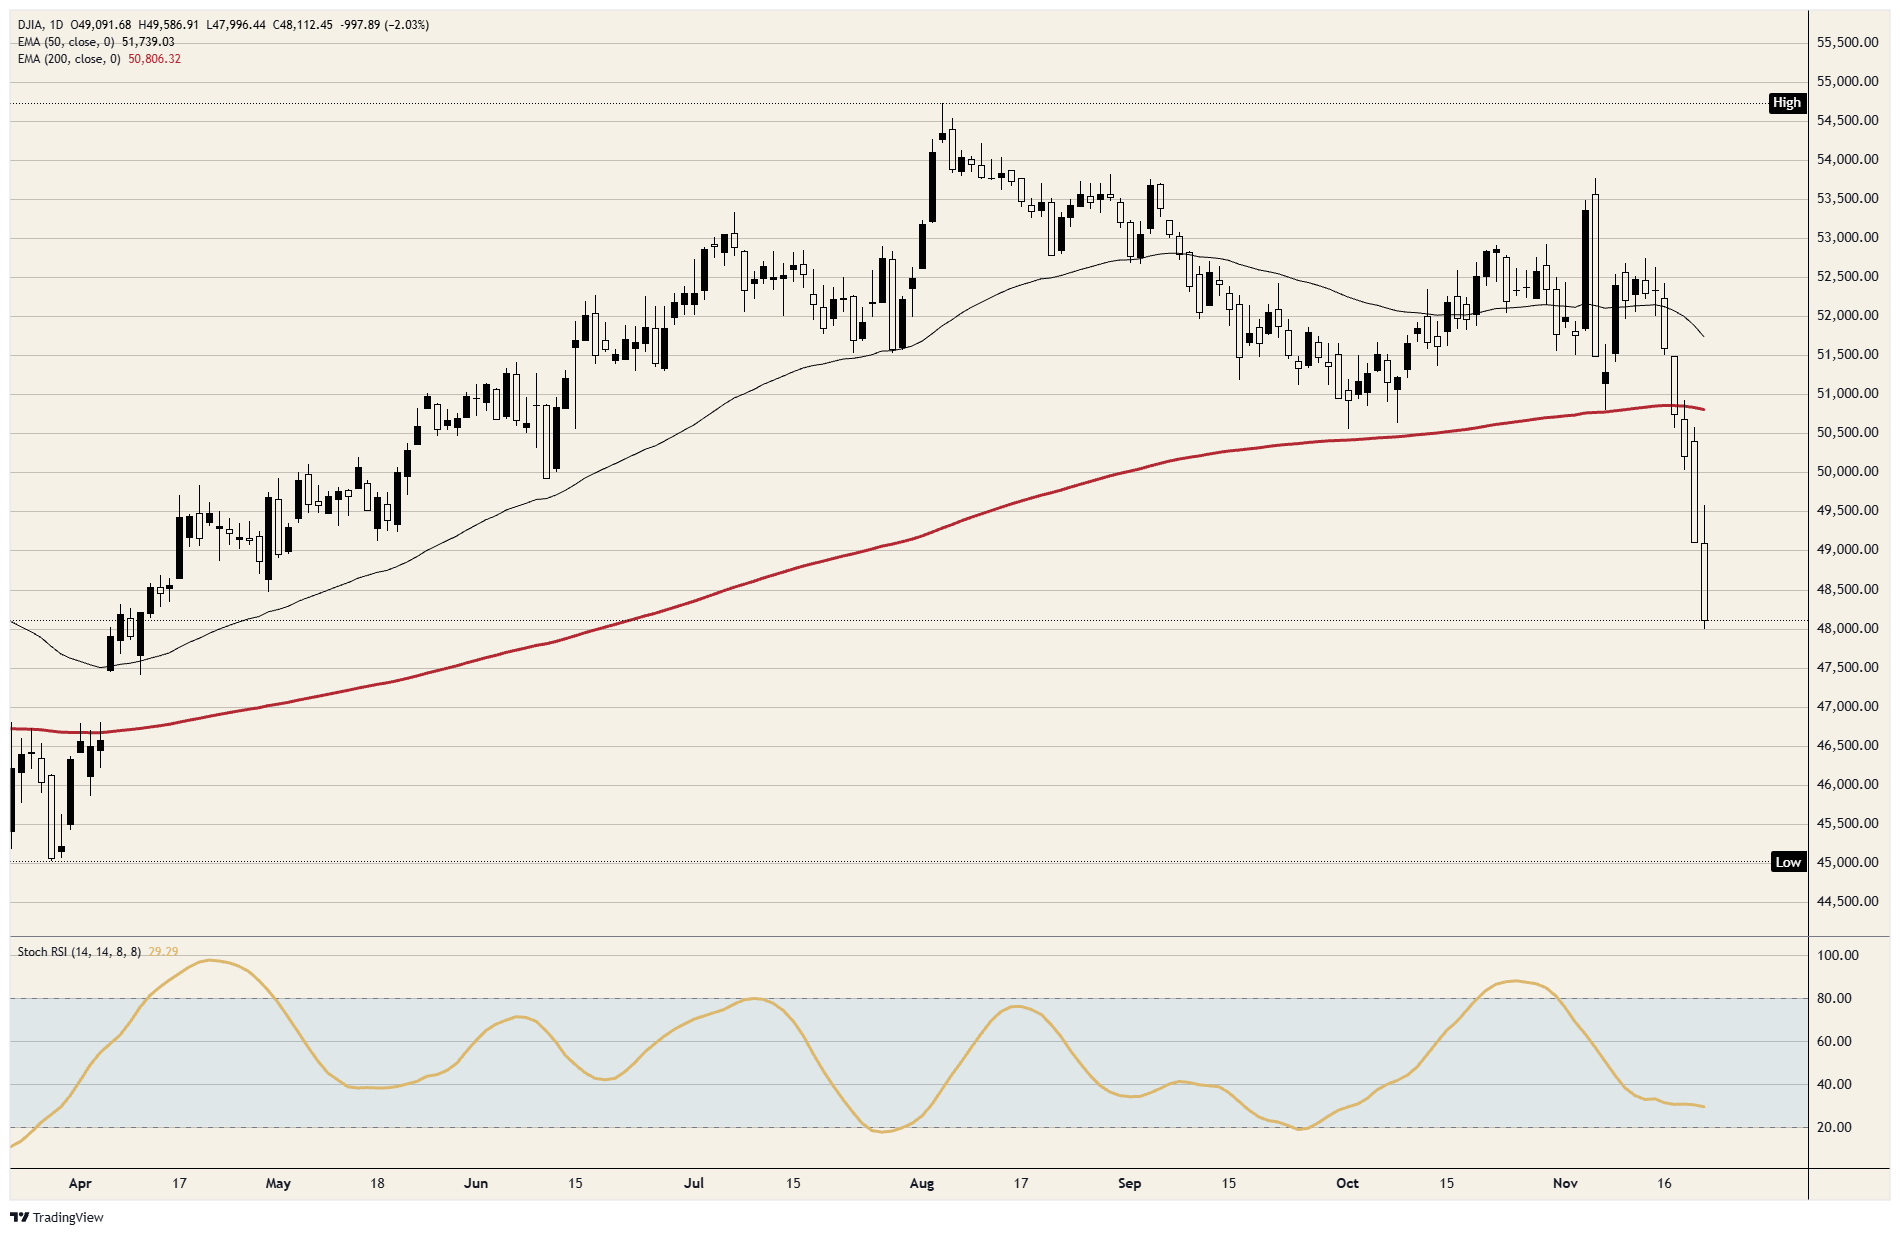
Five falls in five sessions have taken the Dow Jones Industrial Average more than 10% below its August record close, and the selling is no longer confined to artificial intelligence (AI) stocks. The index dropped to just under 48,000, its lowest since April, and is trading near 48,100. Thursday's close under 50,000 was its first since June, and the run is on track to be its worst week since April 2025.
Nvidia (NVDA), a Dow member, is on track for a seventh straight fall after Reuters reported that Securities and Exchange Commission (SEC) enforcement staff are examining its accounting. The shares were lower before the report and doubled the loss after it. The Dow is weighted by share price, so Nvidia near $127 counts for less in it than Goldman Sachs (GS) and Caterpillar (CAT), two of its highest-priced members, which also led the fall.
Anthropic (ANT), whose listing was meant to steady AI stocks, rose 17% on its Thursday debut and traded within 5 cents of its $83 offer price a day later. Fed Governor Cook said September's rate hike wasn't enough to curb inflation, which adds higher borrowing costs to the doubts over AI spending. Walmart (WMT), Johnson & Johnson (JNJ) and Procter & Gamble (PG) rose, which is why the Dow has fallen less than the NASDAQ 100.
On the calendar
US Purchasing Managers Index (PMI) surveys for November come at 14:45 GMT on Monday, before New York Fed President Williams speaks at 21:00 GMT. Traders no longer fully price a Fed hike on December 9, so each Fed speaker now bears on whether one comes at all.
Wednesday, November 25 has October core Personal Consumption Expenditures Price Index (PCE) inflation and the first Gross Domestic Product (GDP) figure for the third quarter at 13:30 GMT, then the Fed's Beige Book at 19:00 GMT. US stock markets are shut on Thursday for Thanksgiving.
On the charts
At Friday's low the index had given back about two-thirds of the climb from April's low near 45,000 to August's peak just under 54,750, and the five-session run accounts for most of that fall. During the run it went through its 200-day Exponential Moving Average (EMA), near 50,750, for the first time since April. The 50-day EMA has turned down near 51,750.
Dow Jones daily chart
Dow Jones FAQs
The Dow Jones Industrial Average, one of the oldest stock market indices in the world, is compiled of the 30 most traded stocks in the US. The index is price-weighted rather than weighted by capitalization. It is calculated by summing the prices of the constituent stocks and dividing them by a factor, currently 0.152. The index was founded by Charles Dow, who also founded the Wall Street Journal. In later years it has been criticized for not being broadly representative enough because it only tracks 30 conglomerates, unlike broader indices such as the S&P 500.
Many different factors drive the Dow Jones Industrial Average (DJIA). The aggregate performance of the component companies revealed in quarterly company earnings reports is the main one. US and global macroeconomic data also contributes as it impacts on investor sentiment. The level of interest rates, set by the Federal Reserve (Fed), also influences the DJIA as it affects the cost of credit, on which many corporations are heavily reliant. Therefore, inflation can be a major driver as well as other metrics which impact the Fed decisions.
Dow Theory is a method for identifying the primary trend of the stock market developed by Charles Dow. A key step is to compare the direction of the Dow Jones Industrial Average (DJIA) and the Dow Jones Transportation Average (DJTA) and only follow trends where both are moving in the same direction. Volume is a confirmatory criteria. The theory uses elements of peak and trough analysis. Dow’s theory posits three trend phases: accumulation, when smart money starts buying or selling; public participation, when the wider public joins in; and distribution, when the smart money exits.
There are a number of ways to trade the DJIA. One is to use ETFs which allow investors to trade the DJIA as a single security, rather than having to buy shares in all 30 constituent companies. A leading example is the SPDR Dow Jones Industrial Average ETF (DIA). DJIA futures contracts enable traders to speculate on the future value of the index and Options provide the right, but not the obligation, to buy or sell the index at a predetermined price in the future. Mutual funds enable investors to buy a share of a diversified portfolio of DJIA stocks thus providing exposure to the overall index.
Related Articles