Academy
Markets

IPOs and what you need to know

This is the point where 'private' becomes 'public'. It gives the market its first real look under the hood of companies like OpenAI, SpaceX and a new wave of ASX hopefuls.

What is an IPO?

An initial public offering (IPO) is when a private company offers its shares to the public for the first time. Before an IPO, shares are usually held only by founders, early employees and private investors but going public opens those shares to a broader market.

For traders, IPOs may be the first opportunity to gain direct exposure to a company's stock. They can create a unique environment of elevated volatility and heightened interest, but they also carry higher risk because price history is limited and sentiment can shift quickly.

US$171.8 billion

Global IPO proceeds in 2025, up 39% year on year

US$3 trillion plus

Combined estimated valuation of top 2026 IPO candidates

1,293

Global listings in 2025, the sharpest rebound since the post-pandemic boom

Upcoming IPOs across global exchanges

CompanyEstimated valuationExchangeStatus
Anthropic
Artificial intelligence
~US$350 billionNasdaqRumoured
Databricks
AI and data
~US$134 billionNasdaqExpected
Firmus Technologies
AI infrastructure
~A$6 billionASXExpected
Greencross
Pet care & veterinary
~A$4 billion plusASXRumoured
OpenAI
Artificial intelligence
~US$850 billionNasdaqExpected
Rokt
E-commerce adtech
~US$7.9 billionNasdaq and ASX CDIExpected
SpaceX
Aerospace and AI
~US$1.5 trillionNasdaqExpected
Stripe
Fintech
~US$140 billionNYSE/NasdaqRumoured
Source: Publicly available company announcements, exchange materials, reputable media reporting and market commentary, as at 21 April 2026. Estimated valuations, exchanges and listing status are indicative only and may change without notice.

US IPO candidates

SpaceX, OpenAI, Anthropic and more

Read more

ASX IPO candidates

Firmus Technologies, Greencross and more

Read more

How a listing works

From boardroom to exchange floor

By listing day, institutional investors have usually already assessed the company. Understanding the six-stage process helps traders see what may already be reflected in the price before the stock opens to the broader market.

Preparation

The company selects an underwriter to assess its finances, corporate structure and market positioning.

Registration

Underwriters conduct due diligence and lodge disclosure documents with the relevant regulator.

Roadshow

Executives pitch to institutional investors and analysts. This is where demand is built and price expectations are set, before retail traders ever see the stock.

Pricing

Based on roadshow feedback, underwriters set the final share price and decide how many shares will be issued.

Listing day

Shares begin trading on the chosen exchange. For most traders, this is the first chance to trade the stock.

Post-IPO

Now public, the company must publish financial results regularly and meet the governance standards of its exchange.

Trading IPOs with CFDs

Why CFDs suit IPO volatility

IPO listing day is often defined by large sentiment swings and thin price history. That combination can make traditional buy-and-hold exposure harder to manage. CFDs let traders take a view on either side of the move, size positions precisely and act quickly as the story develops.

Go long or short

Trade the initial surge or the post-hype correction. CFDs let you take a position in either direction from listing day onward.

Shorter time horizons

IPO volatility tends to compress into the first days and weeks. CFDs are well suited to these shorter, event-driven windows

Built-in risk tools

Stop loss and limit orders can help define your risk beforeentry, which matters when price discovery is still unfolding.

US and Australian market coverage

Access share CFDs across US and Australian markets, including names like Rokt and Firmus Technologies, from one account.

Ready to trade the IPO moment?

Access US and Australian share CFDs with fast execution, competitive pricing, and built-in risk management tools.

Ready to trade the IPO moment?

Access US and Australian share CFDs with fast execution, competitive pricing, and built-in risk management tools.

Get started

News & analysis

Microsoft, Alphabet and NVIDIA sit at the centre of the AI infrastructure buildout, from cloud and enterprise software to custom chips and data-centre demand. Their upcoming results may help show whether heavy capital spending is translating into revenue, margins and durable competitive advantage.
AI
US Earnings
Are Microsoft, Alphabet and NVIDIA about to show whether AI is worth the cost?

April's US earnings season is landing in a market that wants more than a good story. JPMorgan has already set a high bar with a strong result, and attention is now shifting to the engine room of the S&P 500: AI infrastructure where three companies are at the centre of that story.

Why this earnings window matters for AI

Microsoft, Alphabet and NVIDIA are not just participants in the AI cycle, they are building the physical and software architecture that other companies depend on: the chips, the cloud regions, the models and the tools. If this spending is going to deliver returns, the first signs may start to show in their quarterly results over the next few weeks.

Each company represents a different test.

  1. Microsoft: Whether enterprise AI adoption is translating into revenue and margin expansion
  2. Alphabet: Whether owning the full stack, from chips to cloud to distribution, is a durable advantage or simply an expensive position to defend
  3. NVIDIA: Whether the hardware cycle is still holding, accelerating or starting to level out

In 2026, the question is no longer whether AI investment is happening, the capital commitments are substantial and already publicly stated. The question is whether that spending is generating returns quickly enough to justify the scale of those bets.

IMPORTANT: REPORTING SCHEDULES CAN CHANGE WITHOUT NOTICE. REPORTING DATES AND RELEASE TIMES ARE FROM COMPANY INVESTOR RELATIONS CALENDARS WHERE MARKED CONFIRMED; OTHERWISE THEY ARE GO MARKETS ESTIMATES. CONSENSUS EPS, REVENUE AND ANALYST-RANGE DATA ARE FROM THIRD-PARTY MARKET CONSENSUS SOURCES, AS OF 16 APRIL 2026 (AEST). COMPANY GUIDANCE, BACKLOG AND OPERATING METRICS ARE FROM THE LATEST COMPANY FILINGS OR RESULTS PRESENTATIONS UNLESS STATED OTHERWISE. FIGURES AND SCHEDULES MAY CHANGE WITHOUT NOTICE.

$MSFT | Q1 2026 REPORTING PERIOD

Microsoft Corporation

NASDAQ | Technology | 29 Apr 2026
Confirmed

Global Release Countdown (AMC)

00:00:00:00
Reported EPS
US$4.27
Reported Revenue
US$82.9bn
AU/ASIA 30 Apr | 6:05 am
US/LATAM 29 Apr | 4:05 pm
Market Intelligence: $MSFT

Analysis: Microsoft price drivers and scenarios

Azure Growth Target
37-38%
Constant currency projection
AI Contribution
+6-8 pts
Azure revenue from AI services
FY26 Capex
US$146bn
Total infrastructure spending
AVG
LOW US$3.86 AVG US$4.04 HIGH US$4.14

Microsoft is being tested on a specific question: can it turn heavy AI spending into margin expansion? A result above US$4.14 could ease concerns over "capex fatigue" and demonstrate whether Azure growth is re-accelerating alongside enterprise AI adoption.

Factors that could move the markets

Azure growth rate
Watch if constant-currency growth re-accelerates above 39%, suggesting AI workloads are filling new capacity rather than sitting idle.
Signal: Capacity Utilisation
Workplace agent adoption
The shift to autonomous agents is central. Clear enterprise uptake in Dynamics 365 supports the high-tier subscription thesis.
Signal: Software Monetisation
Maia 200 cost savings
If the in-house AI chip is lowering inference costs at production levels, gross margins may start to recover from recent compression.
Watch: Gross Margin Recovery
Regulatory backdrop
Ongoing scrutiny of cloud bundling practices remains a potential headwind; management commentary here is vital for the long-term view.
Watch: Bundling Compliance
Sentiment Analysis · Microsoft Corp.

Interactive scenario analysis: $MSFT

Select earnings outcome
AI Scaling Proof

Strong result, backed by real AI progress

EPS above US$4.14 and Azure re-acceleration above 39% could support the view that AI spending is starting to translate into commercial returns. Workplace Agents show measurable ROI and FY26 guidance is raised.
EPS Outcome
Above US$4.14
Cloud Signal
Accelerating
Guidance
Raised
Possible reaction
Strong rally
Sources & Data Methodology

Sources: Reporting dates and release times are from company investor relations calendars where marked Confirmed; otherwise they are GO Markets estimates. Consensus EPS, revenue and analyst-range data are sourced from Bloomberg and Earnings Whispers, as at 16 April 2026 (AEST). Company guidance, backlog and operating metrics are sourced from the latest company filings or results presentations. Any scenario analysis reflects GO Markets analysis. Figures and schedules may change without notice.

Expanded Coverage

Beyond the chipmakers

As the "show me the money" year unfolds, discover how AI demand is impacting Tesla, NextEra, and Exxon.

Alphabet: search to infrastructure

Alphabet has transformed from a search business into a sprawling AI infrastructure play, and this result will test whether that transformation is delivering. The US$185 billion capex forecast for 2026 is extraordinary, close to double last year's spending.

EPS is expected to decline slightly year on year, precisely because that infrastructure spending is consuming capital. The question is whether Google Cloud's growth is fast enough to show a credible path back to margin recovery, and whether Ironwood, the seventh-generation custom AI chip, is proving its cost-per-query advantage at scale.

$GOOGL | Q1 2026 REPORTING PERIOD

Alphabet Inc.

NASDAQ | Technology | 29 Apr 2026
Confirmed

Global Release Countdown (AMC)

00:00:00:00
Reported EPS
US$5.11
Reported Revenue
US$109.9bn
AU/ASIA 30 Apr | 6:30 am
US/LATAM 29 Apr | 4:30 pm
Market Intelligence: $GOOGL

Analysis: Alphabet price drivers and scenarios

Cloud growth
48% YoY
Compared with last quarter
Ironwood TPU
10x peak
Vs previous-generation chip
2026 Capex
US$185bn
Double last year's spending
AVG
LOW US$2.50 AVG US$2.64 HIGH US$2.80

Alphabet has shifted to being viewed as a broader AI infrastructure play. The question is whether Cloud growth can support a path back to margin recovery while the massive US$185bn infrastructure buildout absorbs capital.

Factors that could move the markets

Google Cloud momentum
Markets are watching if the 48% growth rate holds, specifically among customers using Ironwood TPUs for large-scale AI.
Signal: Enterprise AI Adoption
Search & AI overview
If compute-intensive AI summaries are monetising through ads, it supports core search economics in the AI era.
Focus: Search Economics
Capex & margin trajectory
With free cash flow under pressure from US$185bn capex, markets want to know when infrastructure investment will moderate.
Watch: Spending Ceiling
DOJ antitrust risk
Management commentary on the legal timeline for Chrome or Android divestiture appeals will influence how risk is priced.
Watch: Regulatory Remedies
Sentiment Analysis · Alphabet Inc.

Interactive scenario analysis: $GOOGL

Select earnings outcome
Efficiency Proof

Ironwood efficiency drives upside

EPS above US$2.80 and cloud growth above 45% suggest Ironwood is cutting costs and strengthening Google’s advantage faster than expected.
EPS outcome
Above US$2.80
Cloud Signal
Strong growth
Waymo
Accelerating
Reaction
Sentiment improves
Sources & Data Methodology

Sources: Reporting dates and release times are from company investor relations calendars where marked Confirmed; otherwise they are GO Markets estimates. Consensus EPS, revenue and analyst-range data are sourced from Bloomberg and Earnings Whispers, as at 16 April 2026 (AEST). Company guidance, backlog and operating metrics are sourced from the latest company filings or results presentations. Any scenario analysis reflects GO Markets analysis. Figures and schedules may change without notice.

NVIDIA: the hardware cycle read through

NVIDIA is no longer simply a chip company. It has become what analysts now describe as the central bank of compute, the entity whose product determines how much AI capacity the world can actually deploy.

The upcoming Q1 FY2027 result will test whether the new Vera Rubin R100 GPU architecture, which entered mass production ahead of schedule, is already contributing to revenue, and whether NVIDIA can sustain gross margins above 75% as inference, rather than training, becomes the dominant workload. Inference is more competitive and more price-sensitive than training, so margin resilience here matters.

$NVDA | Q1 2026 REPORTING PERIOD

NVIDIA Corporation

NASDAQ | Semiconductors | 20 May 2026
Confirmed

Global Release Countdown (AMC)

00:00:00:00
Reported EPS
US$1.87
Reported Revenue
US$81.62bn
AU/ASIA 21 May | 6:30 am
US/LATAM 20 May | 4:30 pm
Market Intelligence: $NVDA

Analysis: NVIDIA price drivers and scenarios

Revenue growth
73% YoY
Last quarter benchmark
Data centre share
91%+
Share of total revenue
Rubin R100
In production
Mass production began April 2026
AVG
LOW US$76bn AVG US$78bn HIGH US$81bn+

NVIDIA’s outlook depends on whether Rubin R100 can keep gross margins above 75% as inference becomes a bigger part of demand. Because inference is more price-sensitive than training, margins are the key test.

Factors that could move the markets

Rubin ramp-up
Watch whether Rubin production can scale smoothly without disrupting the Blackwell transition.
Signal: supply chain continuity
Inference margins
The key test is whether NVIDIA can keep gross margins above 75% as inference revenue grows.
Signal: pricing power holds up
Sovereign AI demand
Government-backed investment in Europe and the Middle East could broaden the base beyond hyperscalers.
Signal: market expansion
CUDA regulatory risk
Any US or European scrutiny of NVIDIA’s software advantage could move the stock regardless of the revenue result.
Signal: software moat under review
Sentiment Analysis · NVIDIA Corp.

Interactive scenario analysis: $NVDA

Select earnings outcome
Rubin ramp supports growth

Rubin ramp supports growth

Revenue above US$81 billion may suggest the Rubin ramp is tracking ahead of expectations. That could support the view that AI demand is broadening into sovereign AI and enterprise markets, helping extend visibility into 2027.
Revenue Outcome
Above US$81bn
Gross Margin
Above 75%
Workload
Inference strong
Reaction
Positive read-through
Sources & Data Methodology

Sources: Reporting dates and release times are from company investor relations calendars where marked Confirmed; otherwise they are GO Markets estimates. Consensus EPS, revenue and analyst-range data are sourced from Bloomberg and Earnings Whispers, as at 16 April 2026 (AEST). Company guidance, backlog and operating metrics are sourced from the latest company filings or results presentations. Any scenario analysis reflects GO Markets analysis. Figures and schedules may change without notice.

Thematic Risks

What could shift the picture

Three risks could change the narrative regardless of how the numbers print. Each one is worth understanding before the results land.

Capex fatigue

If both Microsoft and Alphabet report in line or below expectations while reaffirming enormous spending plans, the market may start pricing the risk that AI monetisation is slower than the spending implies. That is not a stock-specific concern. It would be a broader de-rating event, affecting the valuations of companies across the technology sector.

Regulatory escalation

The FTC investigation into Microsoft, the DOJ case against Alphabet, and emerging EU scrutiny of NVIDIA's CUDA software ecosystem are all active. A material legal development before the earnings calls could overshadow the financial results entirely. Regulatory risk in this sector is not theoretical. It is live and moving.

Competition from custom silicon

Microsoft's Maia 200 chip, Alphabet's Ironwood TPU, Amazon's Trainium and Meta's custom accelerators are all reducing how much the large cloud companies depend on NVIDIA hardware. If any of these companies signals a meaningful shift in its GPU procurement plans, that could create uncertainty around NVIDIA's forward order book.

Note: These systemic risks represent thematic pivots that may influence risk appetite independently of headline EPS beats.
The Bottom Line

The 2026 reality check

Microsoft and Alphabet report on the same evening, 29 April. NVIDIA follows in late May. Together, they offer the clearest read yet on whether the AI infrastructure buildout is generating returns fast enough to justify the extraordinary scale of capital being committed.

$MSFT

AI spend is shifting from cost to competitive advantage. The question is whether margins can follow.

$GOOGL

Vertical integration from chips to search to cloud may prove to be a moat, or an expensive position to defend.

$NVDA

This is the pulse of the AI hardware cycle, and a test of whether Rubin can keep the supercycle alive into 2027.

Taken together, they offer a read on a market that looks more physical, more capital-intensive and, for many traders, more real.

Your next earnings setup starts here

Stay ahead of major beats, misses, and market surprises. Log in to your terminal, open a new account, or explore our dedicated earnings academy.

Need help? Contact our support team

GO Markets
April 16, 2026
Why Tesla NextEra and Exxon matter this earnings season, what to watch in Tesla earnings 2026, how AI power demand affects NextEra Energy, what Exxon Mobil earnings could signal for oil markets, Tesla Megapack growth outlook 2026, NextEra data centre power demand explained, Exxon Mobil oil supply risk outlook, energy stocks to watch in April 2026
AI
Commodity
Tesla, NextEra and Exxon: Oil vs. AI demand this US earnings season

April’s US earnings season is arriving in a market that is asking harder questions. It is no longer enough for companies to tell a good story. Traders want to see whether the physical side of the next cycle is turning into real revenue, steadier margins and clearer guidance.

That is why Tesla, NextEra Energy and Exxon Mobil matter this month. Each sits close to a theme the market is trying to price right now: autonomy, electricity demand and oil supply risk. They are very different businesses, but together they offer a useful read on where attention may be shifting when the market wants something more tangible.

In 2026, those signals are colliding with a high-friction backdrop:

  1. AI power demand is pushing utilities, storage and grid capacity into focus
  2. Tesla needs to show that autonomy and energy can support the next chapter beyond EV margins
  3. Oil supply risk has pushed energy security back into the conversation

Why this part of the market matters

The broader theme here is simple. AI still matters. Growth still matters. But this earnings season may also test the companies supplying the power, infrastructure and fuel behind that story.

For beginner to intermediate traders, this matters because these stocks can move for very different reasons. Tesla can trade on margins and product narrative. NextEra can trade on power demand and capital spending plans. Exxon can move with crude, refining margins and buyback confidence. Looking at them together gives traders a clearer way to think about how the market is pricing the real economy side of the 2026 story.

IMPORTANT: REPORTING SCHEDULES CAN CHANGE WITHOUT NOTICE. REPORTING DATES AND RELEASE TIMES ARE FROM COMPANY INVESTOR RELATIONS CALENDARS WHERE MARKED CONFIRMED; OTHERWISE THEY ARE GO MARKETS ESTIMATES. CONSENSUS EPS, REVENUE AND ANALYST-RANGE DATA ARE FROM THIRD-PARTY MARKET CONSENSUS SOURCES, AS OF 14 APRIL 2026 (AEST). COMPANY GUIDANCE, BACKLOG AND OPERATING METRICS ARE FROM THE LATEST COMPANY FILINGS OR RESULTS PRESENTATIONS UNLESS STATED OTHERWISE. FIGURES AND SCHEDULES MAY CHANGE WITHOUT NOTICE.

$TSLA | Q1 2026 REPORTING PERIOD

Tesla Inc.

NASDAQ | Consumer Discretionary | 23 Apr 2026
Confirmed

Global Release Countdown (AMC)

00:00:00:00
Consensus EPS
US$0.41
Consensus Revenue
US$22.26bn
AU/ASIA 24 Apr | 6:05 am
US/LATAM 23 Apr | 4:05 pm
Market Intelligence: $TSLA

Analysis: Tesla price drivers and scenarios

Auto Gross Margin
17-19%
Target floor, excl. credits
Megapack Growth
+25% YoY
Projected energy deployment
Analyst range
US$0.32-0.48
EPS estimate range
AVG
LOW US$0.32 AVG US$0.41 HIGH US$0.48

The US$0.16 analyst range shows there is still a lot of uncertainty. The main question is how weaker vehicle deliveries compare with stronger, higher-margin energy storage contributions. A result above US$0.48 would suggest the autonomy and battery story is improving faster than the bear case expects.

Key factors that could move the result

Automotive gross margin
This is the most important number for Tesla’s core business. Markets want to see whether price cuts have started to settle, or whether margins are still under pressure.
Benchmark: 17% (excluding credits)
Energy storage (Megapacks)
This is the more durable growth story. Strong Megapack deployment and battery margins could help offset weaker vehicle deliveries
Focus: Storage growth versus pressure in the auto business
Full Self-Driving (FSD) & Robotaxi
This is the main narrative driver. Markets will watch for updates on FSD adoption and the robotaxi timeline to judge whether the move towards “physical AI” is becoming more credible.
Watch: Timing for next-generation autonomy technology
Regulatory credits
This is a quality check on the result. If EPS is boosted too much by credit sales, some traders may see the beat as less durable.
Watch: How much credit sales contribute to final EPS
Trade Execution: $TSLA

Earnings reaction framework: Q1 2026

Bull case
EPS above US$0.45, energy margins at 20%+ | FSD take rates rising
The result clears the top-tier analyst range. Commentary focuses on FSD scaling and Megapack production ramps rather than vehicle discounting. FY26 guidance is reaffirmed.
Possible reaction: stronger momentum, with short covering adding support
Base case
EPS between US$0.38 and US$0.43, auto margins stable | Near target
The result is close to expectations, but there is no major surprise from the energy business. The market stays focused on the robotaxi timeline. The initial move may be limited if the product mix looks unchanged.
Possible reaction: range-bound trading or a muted early response
Bear case
EPS below US$0.35, auto margins drop below 16% | Signs of FSD delays
The result misses even cautious expectations. Rising inventory suggests more discounting may be needed. The market starts to question whether the level of spending on AI and autonomy is too high.
Possible reaction: rotation out of the stock, especially if growth confidence weakens
Sentiment Analysis · Tesla Inc.

Interactive scenario analysis: $TSLA

Select earnings outcome
Growth momentum

Strong result, helped by energy and FSD

FSD and Energy do better than expected, which helps offset weaker car deliveries. Management gives the market more confidence that autonomy is getting closer to real revenue. Auto margins staying above 17% would also help.
EPS Outcome
Above US$0.45
Energy Signal
On track
Margins
At or above 17%
Likely Reaction
Strong rally

Sources & Data Methodology Sources: Reporting dates and release times are from company investor relations calendars where marked Confirmed; otherwise they are GO Markets estimates. Consensus EPS, revenue and analyst-range data are sourced from Bloomberg and Earnings Whispers, as at 14 April 2026 (AEDT). Company guidance, backlog and operating metrics are sourced from the latest company filings, results presentations or investor relations materials unless stated otherwise. Any scenario analysis reflects GO Markets analysis. Figures and schedules may change without notice.

From autonomy to electricity

If Tesla is the market’s test of whether physical AI can become a business, NextEra is a test of whether the power buildout behind AI is starting to show up more clearly in utility economics.

That is what makes the shift from Tesla to NextEra interesting. One is about ambition and platform narrative. The other is about power, contracts, infrastructure and return on capital.

$NEE | Q1 2026 REPORTING PERIOD

NextEra Energy, Inc.

NYSE | Utilities | 24 Apr 2026
Confirmed

Global Release Countdown (BMO)

00:00:00:00
Consensus EPS
US$0.91
Consensus Revenue
US$7.17bn
AUSTRALIA (AEST) 24 Apr | 9:35 pm
ASIA (UTC+8) 24 Apr | 7:35 pm
Market Intelligence: $NEE

Analysis: NEE price drivers and scenarios

Backlog Conversion
~29.8 GW
Energy Resources total backlog
Growth Framework
8%+ Annual
Adjusted EPS growth through 2032
Analyst Range
US$0.88 - 1.06
Q1 estimate spread
AVG
LOW US$0.88 AVG US$0.92 HIGH US$1.06

Against the 2026 ‘year of proof’ theme, the key issue is whether upcoming results turn strategic announcements into clearer execution signals. NextEra is a test of whether the power buildout behind AI is starting to show up clearly in utility economics.

Trade Execution: $NEE

Earnings reaction framework: Q1 2026

Key signals to watch

Contract Quality
Watch for movement from customer interest (20+ GW) to signed large load agreements.
Signal: Large load monetization
Natural Gas Hub Strategy
Firmer milestones on the approved up to 10 GW natural gas buildout approved earlier this year.
Signal: Infrastructure execution
Funding Clarity
Monitoring the impacts of the US$2.3bn equity sale and any potential Japanese funding progress.
Signal: Financing risk management
Sentiment Analysis · NextEra Energy

Interactive scenario analysis: $NEE

Select earnings outcome
Execution Focus

"Utility Renaissance" validates via execution signals

EPS above US$1.06 shifts attention to execution. Management points to signed large load agreements and clearer milestones for natural gas buildout. Progress converting 29.8 GW backlog into construction-ready projects strengthens sentiment significantly.
EPS Outcome
Above US$1.06
Infrastructure Signal
Contracts Signed
Likely Reaction
Sentiment Strengthens
Sources & Data Methodology

Sources: Reporting dates and release times are from company investor relations calendars where marked Confirmed; otherwise they are GO Markets estimates. Consensus EPS, revenue and analyst-range data are sourced from Bloomberg and Earnings Whispers, as at 13 April 2026 (AEST). Company guidance, backlog and operating metrics are sourced from the latest company filings or results presentations. Any scenario analysis reflects GO Markets analysis. Figures and schedules may change without notice.

From power to oil

If NextEra reflects the electricity side of the real economy story, Exxon Mobil reflects the fuel side. That matters in a market where supply risk can still reset inflation expectations, shift sector leadership and change how traders think about defensiveness.

$XOM | Q1 2026 REPORTING PERIOD

Exxon Mobil Corporation

NYSE | Energy | 29 Apr 2026
Estimated

Global Release Countdown (BMO)

00:00:00:00
Consensus EPS
US$1.66
Consensus Revenue
US$82.47bn
AUSTRALIA (AEST) 29 Apr | 8:30 pm
ASIA (UTC+8) 29 Apr | 6:30 pm
Market Intelligence: $XOM

Analysis: XOM price drivers and scenarios

Liquids Pricing Effect
+$1.9B - $2.3B
Positive 1Q realized price support
Energy Products Timing
-$3.3B to -$4.1B
Unfavourable 1Q accounting drag
Analyst Range
US$1.60 - 1.85
Low to high Q1 estimate spread
AVG
LOW US$1.60 AVG US$1.66 HIGH US$1.85

Exxon is the clearest oil-linked test in the market. The key issue is whether stronger oil and gas pricing can outweigh volume disruptions (6% production hit) and massive negative timing effects from Energy Products.

Trade Execution: $XOM

Earnings reaction framework: Q1 2026

Key signals to watch

Price Support vs Volume
Did the $2.3B pricing tailwind absorb the 6% Middle East production disruption?
Signal: Realized price strength
Timing Reversibility
Management commentary on whether the $4.1B timing drag is strictly non-cash and accounting-related.
Signal: Quality of earnings beat
Guyana Execution
Operational updates on the core upstream portfolio to ensure the long-term growth story remains constructive.
Signal: Upstream resilience
Sentiment Analysis · Exxon Mobil

Interactive scenario analysis: $XOM

Select earnings outcome
Price Support

Pricing tailwind more than absorbed the disruption

EPS above US$1.85 suggests high realized pricing from liquids absorbed volume hits. Management indicates timing effects were less severe than feared, with constructive operational updates from Guyana and the broader upstream portfolio.
EPS Outcome
Above US$1.85
Timing Impact
Smaller than feared
Likely Reaction
Sentiment Strengthens
Sources & Data Methodology

Sources: Reporting dates from company investor relations (Estimated for April 29, BMO). Consensus EPS and analyst-range data from Bloomberg and Earnings Whispers as at 13 April 2026 (AEDT). Scenario analysis reflects evaluateions of internal energy considerations. Figures and schedules are subject to change without notice.

Bottom line This late-April energy cluster is about more than three company reports. It is a live test of what the market wants to pay for in 2026. Tesla can show whether autonomy and energy are becoming more than a promise. NextEra can show whether rising electricity demand is turning into practical utility growth. Exxon can show whether oil strength still translates into durable earnings power. Taken together, they offer a useful read on the part of the market that looks more physical, more capital-intensive and, for many traders, more real.

Your next earnings setup starts here

Stay ahead of major beats, misses, and market surprises. Log in to your terminal, open a new account, or explore our dedicated earnings academy.

Need help? Contact our support team

GO Markets
April 15, 2026
US Earnings
AI
Defence, disruption and big finance: 3 names worth watching this earnings season

So here is the thing: April’s US earnings season is arriving in a market that still feels anything but normal. As GO Markets explains in The global US earnings playbook: The essential guide for traders, this reporting period is landing after a real shift in what markets care about. It is no longer just about chasing growth at any cost. It is about what the numbers are saying beneath the surface.

And in 2026, those signals are colliding with a high-friction backdrop:

  1. Geopolitical conflict: Ongoing tension in the Middle East
  2. Oil supply shock: Brent crude above US$100
  3. The Fed: A central bank still boxed in by sticky inflation

The durability pivot

Yes, AI is still the market’s main story but it's still the flashy engine getting most of the attention. But underneath that, there is a quieter move towards companies that look built to hold up better when conditions get harder.

When rates are uncertain and energy markets are under pressure, names like JPMorgan Chase and the major defence contractors start to carry more weight. They are not replacing the AI narrative, rather, they are becoming part of the way traders read risk appetite, earnings durability and, ultimately, where the market is looking for something more solid to hold on to.

! Important: Reporting schedules can change without notice. Reporting dates and release times are from company investor relations calendars where marked Confirmed; otherwise they are GO Markets estimates. Consensus EPS, revenue and analyst-range data are from third-party market consensus sources, as of 7 April 2026 (AEDT). Company guidance, backlog and operating metrics are from the latest company filings or results presentations unless stated otherwise. Figures and schedules may change without notice.
$JPM | Q1 2026 REPORTING PERIOD

JPMorgan Chase & Co.

NYSE | Financial Services | 14 Apr 2026
Reported

Global Release Countdown (BMO)

RELEASE LIVE
Reported EPS
US$5.94
Reported Revenue
US$50.54bn
Market Intelligence: $JPM

Analysis: JPM price drivers and scenarios

NII guidance
~US$103 billion
Full year | US$95 billionn ex:markets
ROTCE target
17%
Possible return on tangible common equity
Analyst range
US$5.02-5.70
Low to high estimate spread
AVG
LOW US$5.02 AVG US$5.39 HIGH US$5.70

The analyst spread of US$0.68 signals genuine disagreement about how the rate environment is flowing through to margins. A result above consensus but below the high end estimate may produce a muted reaction. A result above US$5.70 may shift the discussion.

Key swing factors for the result

Net interest income (NII)
The clearest macro lever. It reflects the gap between lending rates and deposit costs.
Guidance: US$103 billion for the full year
Return on tangible common equity (ROTCE)
A scale check. It indicates whether JPM is converting scale into efficiency. 17% is the benchmark.
Target: 17% ROTCE
Trading and investment banking
Strong Q1 growth was expected in fees and markets revenue. These lines can offset softness in lending, and stronger-than-expected performance here may shift the narrative away from rate sensitivity.
Watch: investment banking (IB) fees versus the prior quarter
Expense discipline
A bank can beat the EPS estimate and still sell off if expense growth is running too hot. Pairing the EPS result with the expense trajectory gives a fuller read on whether the beat is durable.
Watch: Expense outlook commentary
Trade Execution: $JPM

Earnings reaction framework: Q1 2026

Bull case
EPS above US$5.70, NII on track | ROTCE at or above 17%
The result comes in above the top of the analyst range. NII guidance holds or is revised higher. IB fees and markets revenue show strong Q1 growth. Expense commentary is constructive.
Possible reaction: momentum and repositioning
Base case
EPS between US$5.39 and US$5.70, NII in line | ROTCE near target
The result beats consensus but stays within the expected range. NII tracks guidance. The tone of the conference call may matter more than the headline number. The first move may fade if guidance is unchanged.
Possible reaction: muted or mixed initial response
Bear case
EPS below US$5.39 | NII misses | Expense growth surprises
The result comes in at or below the consensus midpoint. NII guidance is cut or qualified. Expense growth comes in above market expectations. IB or markets revenue disappoints.
Possible reaction: earnings multiple repricing

Reaction trigger to watch: The market response in the first 30 minutes after the result may indicate which scenario traders are leaning towards. A move above the prior session high on volume may support the bull case. A fade back into the range after an initial pop may point to the base case. A break below the prior session low on volume may suggest the bear case is gaining traction.

Sentiment Analysis · JPMorgan Chase

Interactive scenario analysis: $JPM

Select earnings outcome
Growth momentum

AI-linked offset, beat supported by NII and ROTCE

Stronger-than-expected demand for AI-related industrial lending may offset softer mortgage activity. Management maintains guidance as NII remains resilient in higher-for-longer conditions. IB fees and markets revenue may provide additional support. ROTCE at or above 17% would suggest the bank is converting scale into earnings efficiently.
EPS Outcome
Above US$5.70
NII Signal
On track
ROTCE
At or above 17%
Likely Reaction
Momentum may build

Sources & Data Methodology Sources: Reporting dates and release times are from company investor relations calendars where marked Confirmed; otherwise they are GO Markets estimates. Consensus EPS, revenue and analyst-range data are sourced from Bloomberg and Earnings Whispers, as at 7 April 2026 (AEDT). Company guidance, backlog and operating metrics are sourced from the latest company filings, results presentations or investor relations materials unless stated otherwise. Any scenario analysis reflects GO Markets analysis. Figures and schedules may change without notice.

From credit to defence

If JPMorgan gives the market an early read on the consumer, credit quality and business activity, the defence names may be telling a different story. This is the point where the focus may start to shift from the credit cycle to government-backed demand.

In a market still shaped by geopolitical risk, that matters. Long-dated programs can help support revenue visibility, even when the broader outlook looks less certain. That is one reason the sector remains on the watchlist.

$LMT | Q1 2026 REPORTING PERIOD

Lockheed Martin Corp.

NYSE | Aerospace | Defense | 23 Apr 2026
Confirmed

Global Release Countdown (BMO)

00:00:00:00
Reported EPS
US$6.44
Reported Revenue
US$18bn
AU | ASIA 23 Apr | 9:20 pm
US | LATAM 23 Apr | 7:20 am
Market Intelligence: $LMT

Analysis: LMT price drivers and scenarios

Order backlog
US$194 billionn
Record visibility
Book-to-bill
1.2x
Orders outpacing sales
Analyst range
US$6.90-7.10
Low to high estimate spread
AVG
LOW ~US$6.90 AVG ~US$6.94 HIGH US$7.10+

The consensus sits near the lower end of the analyst range. That positioning may leave room for upside if backlog growth and F-35 delivery timelines support execution. A print near the high end, above US$7.10, may extend the move, although the reaction would still depend on guidance and margins.

Key swing factors for the result

Backlog visibility
Primary evidence of demand. Book-to-bill above 1.2x would support full-year guidance and the production ramp.
Backlog: US$194 billion record
Free cash flow (FCF)
Defence stocks are often assessed on cash conversion. The market may look for confirmation of the US$6.5 billion floor.
Guide: US$6.5 billion - $6.8 billion
Missile segment growth
PrSM and THAAD deliveries remain key watchpoints. Strong space margins may help offset softness in aeronautics.
Watch: Fire Control margins
Margin pressure
Pension charges and production inflation remain risks. An earnings beat may fade if operating margins contract.
Watch: segment operating margin
Trade Execution: $LMT

Earnings reaction framework: Q1 2026

Bull case
EPS above US$6.70, backlog visibility confirmed | FCF guide holds
The result clears the upper half of the analyst range. Management reaffirms or raises the full-year FCF outlook. Strong Missiles and Fire Control (MFC) margins help offset any aeronautics supply chain lag.
Possible reaction: momentum may build and positioning may improve
Base case
EPS between US$6.30 and US$6.70 | Backlog steady at about US$194 billion
The result aligns with the US$6.38 consensus. F-35 delivery pace remains on track but offers no meaningful upside surprise. The market may wait for more specific segment guidance on the conference call.
Possible reaction: muted or mixed initial response
Bear case
EPS below US$6.30 | FCF guide qualified, margin contraction
The result falls towards the bottom of the analyst spread. Management cites further software delays or program losses. The FCF trajectory narrows towards the lower end of previous expectations.
Possible reaction: the share price may come under pressure

Reaction trigger to watch: The market response in the first 30 minutes after the result may indicate which scenario traders are leaning towards. A move above the prior session high on volume may support the bull case. A fade back into the range after an initial pop may point to the base case. A break below the prior session low on volume may suggest the bear case is gaining traction.

Sentiment Analysis · Lockheed Martin

Interactive scenario analysis: $LMT

Select earnings outcome
Backlog confirmed

Backlog and FCF confirmation may support continuation

EPS clears the top of the analyst range. Backlog holds at or above US$194 billion and book-to-bill stays above 1.2, which would suggest orders are replenishing faster than revenue is being recognised. FCF guidance holds within the stated range.
EPS outcome
Above US$7.00
Backlog signal
Above US$194 billion
FCF guide
Holds or improves
Likely reaction
Continuation may follow

Sources & Data Methodology Sources: Reporting dates and release times are from company investor relations calendars where marked Confirmed; otherwise they are GO Markets estimates. Consensus EPS, revenue and analyst-range data are sourced from Bloomberg and Earnings Whispers, as at 7 April 2026 (AEDT). Company guidance, backlog and operating metrics are sourced from the latest company filings, results presentations or investor relations materials unless stated otherwise. Any scenario analysis reflects GO Markets analysis. Figures and schedules may change without notice.

Not all defence names are the same

Lockheed Martin and Northrop Grumman may sit in the same defence bucket, but the market does not always read them the same way. Lockheed is more closely tied to the F-35 and current air combat demand. Northrop is more closely linked to next-generation programs such as the B-21 Raider and Sentinel.

That gives this section its contrast. One is often read through the lens of current defence demand. The other is more closely tied to longer-cycle strategic modernisation.

$NOC | Q1 2026 REPORTING PERIOD

Northrop Grumman Corp.

NYSE | Defense | Space Systems | 21 Apr 2026
Confirmed

Global Release Countdown (BMO)

00:00:00:00
Reported EPS
US$6.14
Reported Revenue
US$9.8 bn
AU | ASIA 21 Apr | 10:30 pm
US | LATAM 21 Apr | 8:30 am
Market Intelligence: $NOC

Analysis: NOC price drivers and scenarios

Consensus EPS
US$6.96
Quarterly analyst average
Order Backlog
US$95.7 billion
Record revenue visibility
FY 2026 EPS guide
US$27.40-US$27.90
Full-year 2026 outlook
AVG
LOW ~US$6.90 AVG ~US$6.96 HIGH US$7.20+

The consensus sits near the lower end of the analyst range. That offers a quick visual for whether the result is merely in line or strong enough to ease the guidance concerns that weighed on the stock after its last update. A result above US$7.20 may shift the conversation more materially.

Key swing factors for the result

Book-to-bill ratio
Currently at 1.10, suggesting orders are still running ahead of revenue recognition. This remains an important signal for multi-year growth visibility in defence.
Watch: 1.10 target
Guidance reset risk
Management’s guidance previously came in below market expectations. The market may be sensitive to any further softening in the 2026 outlook.
Watch: guidance commentary
Program concentration
The B-21 Raider and Sentinel carry outsized execution sensitivity. Updates on production ramp and funding may be the clearest drivers of sentiment for the stock.
Watch: B-21 and Sentinel updates
Capacity investment
Higher capital expenditure (capex) supports the industrial base over the longer term, but it may pressure near-term margins. Watch for signs that current investment is weighing on earnings power.
Watch: operating margins
Trade Execution: $NOC

Earnings reaction framework: Q1 2026

Bull case
EPS above US$6.30, backlog expansion above US$96 billion | Free cash flow (FCF) guidance raised
The result comes in above the cited threshold. Management says B-21 Raider production is ahead of schedule, with improving margins. Sentinel program restructuring costs remain below baseline expectations. International awards lift the book-to-bill ratio above 1.15.
Possible reaction: momentum may improve
Base case
EPS between US$6.00 and US$6.20, backlog steady at about US$95.7 billion
The result is broadly in line with the cited range. FCF targets for 2026 are reaffirmed but not expanded. Market focus shifts to organic sales growth metrics and segment operating margins. The initial reaction may depend on the timing of B-21 milestone payments.
Possible reaction: little reaction
Bear case
EPS below US$5.95 | margin pressure, guidance narrowed
The result lands near the low end of the analyst spread. Management flags higher infrastructure costs for Sentinel or delays in restricted space segment awards. Margin pressure in Aeronautics persists, and the 2026 revenue guide narrows towards the US$43.5 billion floor.
Possible reaction: shares may weaken

Reaction trigger to watch: The market response in the first 30 minutes after the result may indicate which scenario traders are leaning towards. A move above the prior session high on volume may support the bull case. A fade back into the range after an initial pop may point to the base case. A break below the prior session low on volume may suggest the bear case is gaining traction.

Sentiment Analysis · Northrop Grumman

Interactive scenario analysis: $NOC

Select earnings outcome
Stealth momentum

B-21 momentum, stronger execution and FCF support

EPS clears US$6.15. Management confirms a production capacity agreement for the B-21 Raider. Sentinel restructuring reaches Milestone B on schedule. Record backlog visibility and higher FCF guidance towards US$3.5 billion may support broader repositioning.
EPS outcome
Above US$6.15
B-21 Signal
Acceleration
FCF guide
$3.5 billionn range
Likely reaction
Momentum rally

Sources & Data Methodology Sources: Reporting dates and release times are from company investor relations calendars where marked Confirmed; otherwise they are GO Markets estimates. Consensus EPS, revenue and analyst-range data are sourced from Bloomberg and Earnings Whispers, as at 7 April 2026 (AEDT). Company guidance, backlog and operating metrics are sourced from the latest company filings, results presentations or investor relations materials unless stated otherwise. Any scenario analysis reflects GO Markets analysis. Figures and schedules may change without notice.

Bottom line

In a market shaped by geopolitical risk and shifting rate expectations, companies with visible demand and longer-cycle revenue may continue to attract attention. But sentiment can still turn quickly if valuations are stretched, rate expectations shift again, or tensions in the Middle East ease.

That is why the story still needs to be tested against the numbers, not just the narrative. GO Markets will be analysing more companies throughout this earnings season. For more updates, visit our earnings page, follow our social media channels, or check the weekly newsletters.

Your next earnings setup starts here

Stay ahead of major beats, misses, and market surprises. Log in to your terminal, open a new account, or explore our dedicated earnings academy.

Need help? Contact our support team

GO Markets
April 7, 2026
US Earnings
Shares
The global US earnings playbook: The essential guide for traders

If you have been watching markets over the past year, you will have noticed that the "growth at any cost" era has effectively hit a wall. The April 2026 earnings cycle arrives at a moment when the market's focus has undergone a structural reorientation. It is not just about profit and loss statements anymore. It is about the signals sitting behind them.

With interest rate uncertainty lingering and geopolitical shocks pushing oil above US$100, the playbook has shifted from AI hype toward institutional resilience and the industrialisation of compute. For traders in Australia, Asia and Latin America, these results may act as a mood ring for global risk appetite and the emerging security supercycle.

Important - Dates, Times and Figures

All earnings dates marked as confirmed or estimated should be verified against current company investor relations calendars before you act on them. Reporting schedules can change without notice due to corporate decisions, regulatory requirements or exchange timetable adjustments.

The mechanics: How the timing works across time zones

The US earnings season does not arrive as a smooth drip. It arrives in waves. For non-US traders, the primary challenge is the overnight gap: major results land while you are away from your desk and can move index CFDs before your local market opens. Before market open (BMO) and after market close (AMC) matter just as much as the numbers themselves. The timing changes how quickly markets react, when liquidity is available and whether the first move has already happened before your session begins.

Why BMO and AMC matter

A BMO result hits before the US cash market opens, so price discovery happens in pre-market trading where liquidity is thinner and moves can be exaggerated. An AMC result hits after close, meaning the reaction is compressed into a short pre-market window the following morning. Understanding which window your company reports in is as important as understanding what it reports.

Institutional Grade Performance

Master the Markets with MetaTrader 5

Trade hundreds of instruments with superior speed and advanced technical analysis. Harness full EA functionality to execute your strategy.

Need to access your terminal? Log in to Client Portal

The key themes for Q1

For this cycle, the market is no longer rewarding AI mentions alone. It is looking for return on investment (ROI) proof. The four thematic snapshots below help explain where attention is likely to sit as results come through. Each theme has its own section with company cards that can be updated each quarter.

T1
Theme 1 — Institutional anchors

Defence against volatility

These companies are often watched as relative defensives during energy shocks and inflation spikes, although they remain exposed to normal share-price risk. When macro uncertainty rises, money has historically rotated toward businesses with contracted revenue, government-linked demand or pricing power that is not dependent on the consumer cycle — but past rotation patterns do not guarantee future performance.

JPM
JPMorgan Chase
Tuesday, 14 April Confirmed
Watch For

Net interest margin (NIM) under higher for longer rates, and whether AI spending remains cost neutral.

LMT
Lockheed Martin
Wednesday, 22 April Estimated
Watch For

F-35 delivery schedules and the company's ability to absorb tariff related costs on supply chain inputs.

NOC
Northrop Grumman
Monday, 27 April Confirmed
Watch For

B-21 Raider production progress and the conversion of its reported US$95.7 billion backlog into recognised revenue.

T2
Theme 2 — Tangible capital

EVs and energy

As parts of tech slow, investors have been rotating toward tangible, capital-intensive businesses. The energy transition and the infrastructure required to support AI data centre power demand have put utilities and energy companies in an unusual position: they are now growth stocks with defensive characteristics — though all remain subject to ordinary equity and sector risk.

TSLA
Tesla
Thursday, 23 April Confirmed
Watch For

The strategic shift from EV margins toward robotaxi and energy storage as the new growth narrative.

NEE
NextEra Energy
Friday, 24 April Estimated
Watch For

Data centre power demand and progress on its reported 30 GW contracted backlog as utilities face new infrastructure pressure.

XOM
Exxon Mobil
Wednesday, 29 April Estimated
Watch For

Permian and Guyana volume growth, and cash flow resilience during the Hormuz supply disruption.

T3
Theme 3 — The hardware invoice phase

AI infrastructure

This is the engine room of the S&P 500 and the part of the market most tied to whether AI capital expenditure is generating measurable returns. The question the market is now asking is not whether these companies are spending on AI. It is whether the spending is translating into capacity utilisation and revenue that justifies the multiple.

MSFT / GOOGL
Microsoft and Alphabet
Monday, 27 April Estimated
Watch For

Azure and Cloud capacity constraints against heavy AI capital expenditure. The gap between spending and utilisation is the market's primary concern.

NVDA
NVIDIA
Wednesday, 27 May Estimated
Watch For

Blackwell GPU demand and gross margin sustainability as the product cycle matures and competition intensifies.

T4
Theme 4 — K-shaped recovery

Consumer platforms and devices

This theme tests the K-shaped consumer recovery: higher-income cohorts remain more resilient while lower-income cohorts face continued pressure from elevated borrowing costs and energy prices. Ad revenue and device upgrade cycles are the clearest indicators of where on the K-curve the consumer sits.

META / AMZN
Meta and Amazon
28 to 29 April Estimated
Watch For

AI-driven ad click improvements against Reality Labs spending and retail logistics costs as the profitability test for non-core investment.

AAPL
Apple
Thursday, 30 April Estimated
Watch For

iPhone upgrade cycle momentum and the Apple Intelligence rollout in China as the first real-world test of AI-driven hardware demand.

Analysis checklist: how to read each result

Use this structure for every company on your watchlist. A headline beat is common. The bigger market move often comes from how the market translates the details sitting behind the number.

1
Projected consensus

This is the bar for earnings per share (EPS) and revenue. Small beats may already be priced in. The market often sets a whisper number above the published consensus, so a technically positive result can still disappoint.

2
The call focus

Identify the single variable analysts are most focused on this cycle: capital expenditure versus margins, inventory turnover, customer growth rate, or contract backlog conversion.

3
The translation

A beat, meet or miss each carries a different market dynamic.

Beat Matters most when forward guidance is credible. Without it, the initial move may reverse.
Meet Often shifts focus to the tone of the call, particularly language around capacity or outlook.
Miss Can be treated as the start of a trend and trigger a sharp repricing of valuation multiples.

The recency bias problem

The emotional trap many traders fall into is recency bias. Because the Magnificent 7 have led markets for so long, it can feel as though they are still the only trade that matters. That assumption deserves to be tested.

It's worth asking: Is the obvious trade already priced for perfection?

2026 is shaping up as a year of proof. Companies that spent heavily on AI over the past two years are now being asked to show the return. The market is no longer rewarding the announcement of AI investment. It is rewarding the evidence of AI-driven revenue outcomes.

A better framing question for each result is this: are you reacting to a headline, or are you assessing the company's role in the physical AI supply chain or as a potential volatility hedge? Those are very different analytical tasks, and they tend to produce very different positioning decisions.

What to watch next

Three time horizons, three distinct signals. Update these each cycle with the most relevant near-term catalyst, the sector rotation to watch, and the longer-horizon dispersion theme.

Next Two Weeks
Consumer health barometer

Watch the 31 March Nike report as a lead indicator for consumer discretionary health. Footwear and apparel demand signals tend to front-run broader retail sentiment.

Next 30 Days
Bank lending and industrial demand

Focus shifts to the major banks. If loan demand tied to industrial and infrastructure projects remains firm, the earnings cycle may have support beyond the tech sector.

Next 60 Days
Wider dispersion between winners and losers

Watch for dispersion to widen. The companies converting heavy capital expenditure into measurable revenue outcomes may separate clearly from those that cannot.

Client & Education Portal

Follow the US Reporting Season

Stay ahead of major beats, misses, and market surprises. Log in to your terminal, open a new account, or explore our dedicated earnings academy.

Need help? Contact our support team

GO Markets
March 31, 2026
The Fed enters April with rates at 3.50% to 3.75%, Brent crude above US$100 and inflation pressures still not fully solved. March CPI, payrolls, Q1 GDP and the 28 to 29 April FOMC could determine whether rate cuts stay on hold for much of 2026.
Central Banks
Geopolitical events
Fed watch April 2026: Oil, inflation and the FOMC explained

Here is the situation as April begins. A war is affecting one of the world's most important oil chokepoints. Brent crude is trading above US$100. And the Federal Reserve (Fed), which spent much of 2025 engineering a soft landing, is now facing an inflation threat driven less by wages, services or the domestic economy, and more by energy. It is watching an oil shock.

The Fed funds rate sits at 3.50% to 3.75%. The next Federal Open Market Committee (FOMC) meeting is on 28 and 29 April and the key question for markets is not whether the Fed will cut, it is whether the Fed can cut, or whether the energy shock may have shut that door for much of 2026.

A heavy run of major data releases lands in April. The March consumer price index (CPI), non-farm payrolls (NFP) and the advance estimate of Q1 gross domestic product (GDP) are the three that matter most. But the FOMC statement on 29 April may be the release that sets the tone for the rest of the year.

Fed Funds Rate

3.50%–3.75%

Next FOMC

28–29 April 2026

Brent crude

Above US$100

Key data events

12 major releases

Growth: Business activity and demand

Think about what the US economy looked like coming into this year: AI-driven capital expenditure (capex) was a major part of the growth narrative, corporate investment intentions looked firm and the One, Big, Beautiful Bill Act was already in the mix. On paper, the growth story looked solid.

Then the Strait of Hormuz situation changed the calculus. Not because the US is a net energy importer, it is not, and that structural insulation matters. But what is good for US energy producers can still squeeze margins elsewhere and weigh on global demand. The 30 April advance Q1 gross domestic product (GDP) estimate is now likely to be read through two lenses: how strong was the economy before the shock, and what it may signal about the quarters ahead.

Key dates (AEST)

2
Apr
US international trade in goods and services (February)
Bureau of Economic Analysis  ·  10:30 pm AEDT
Medium
30
Apr
Q1 GDP — advance estimate
Bureau of Economic Analysis  ·  10:30 pm AEST
High

What markets look for

  • Resilience in Q1 GDP despite the elevated interest rate environment and early energy cost pressures
  • Trade balance movements linked to shifting global tariff frameworks
  • Business investment intentions following passage of the "One Big Beautiful Bill Act"
  • Early signs of capacity constraints emerging in technology-heavy sectors

How this data may move markets

Scenario Treasuries USD Equities
Stronger than expected growth Yields rise Firmer Mixed - depends on inflation read
Softer growth/GDP miss Yields fall Softer Risk off if stagflation narrative builds

Labour: Payrolls and employment

February's jobs report was, depending on how you read it, either a blip or a warning sign. Non-farm payrolls (NFP) fell by 92,000, unemployment edged up to 4.4% and the official line was that weather played a role. That may be true but here is what also happened. The labour market suddenly looked a little less convincing as the main argument for keeping rates elevated.

The 3 April employment report for March is now genuinely consequential. A bounce back to positive payroll growth would probably steady nerves and a second consecutive soft print, particularly against a backdrop of higher energy prices, would start to build a very uncomfortable narrative for the Fed. It would be looking at slower jobs growth and an inflation threat at the same time. That is not a comfortable place to be.

Key dates (AEST)

3
Apr
March employment situation (NFP and unemployment rate)
Bureau of Labor Statistics  ·  10:30 pm AEDT
High
30
Apr
Q1 employment cost index
Bureau of Labor Statistics  ·  10:30 pm AEST
Medium

What markets look for

  • A return to positive payroll growth, or confirmation that February's softness was the start of a trend
  • Stabilisation or further movement in the unemployment rate from 4.4%
  • Average hourly earnings growth relative to core inflation — the wage-price dynamic the Fed watches closely
  • Weekly initial jobless claims as a real-time signal of whether layoff activity is rising

Inflation: CPI, PPI and PCE

Here is the uncomfortable truth about where inflation sits right now. Core personal consumption expenditures (PCE), the Fed's preferred gauge, was already running at 3.1% year on year in January, before any oil shock had fed through. The Fed had not fully solved its inflation problem, rather, it had slowed it down. That is a different thing.

And now, on top of a not-quite-solved inflation problem, oil prices have moved sharply higher. Energy prices can feed into the consumer price index (CPI) relatively quickly, through petrol, transport and logistics costs that can eventually show up in the price of nearly everything. The 10 April CPI print for March is probably the most important single data release of the month, it is the one that may tell us whether the energy shock is already showing up in the numbers the Fed watches.

Key dates (AEST)

10
Apr
Consumer price index (CPI) — March
Bureau of Labor Statistics  ·  10:30 pm AEST
High
14
Apr
Producer price index (PPI) — March
Bureau of Labor Statistics  ·  10:30 pm AEST
Medium
30
Apr
Personal income and outlays incl. PCE price index — March
Bureau of Economic Analysis  ·  10:30 pm AEST
High

What markets look for

  • Monthly CPI acceleration driven by energy and shelter components — the two stickiest inputs
  • PPI as a forward-looking signal: producer cost pressure tends to feed into consumer prices with a lag
  • PCE trends relative to the Fed's 2% target, particularly the core reading that strips out food and energy
  • Any sign that AI-related pricing power is feeding into corporate margins in ways that sustain elevated core readings

How this data may move markets

Scenario Treasuries USD Gold
Cooling core inflation Yields fall Softer Supportive
Sticky or rising inflation Yields rise Firmer Headwind

Policy, trade and earnings

April is also the start of US earnings season, and this quarter's results carry an unusual amount of weight. Investors have been pouring capital into AI infrastructure on the basis that returns are coming. The question is when. With geopolitical volatility driving a rotation away from growth-oriented technology and towards energy and defence, JPMorgan Chase's 14 April earnings will be read as much for what management says about the macro environment as for the numbers themselves.

Then there is the FOMC meeting on 28 and 29 April. After the early-April run of data, including NFP, CPI and producer price index (PPI), the Fed will have more than enough information to update its language. Whether it signals that rate cuts could remain on hold through 2026, or whether it leaves the door slightly ajar, may be the most consequential communication of the quarter.

Geopolitical volatility has already pushed investors to reassess growth-heavy positioning. The estimated US$650 billion AI infrastructure buildout is also coming under heavier scrutiny on return on investment. If earnings season disappoints on that front, and if the FOMC signals a prolonged hold, the combination could test risk appetite heading into May.

Monitor this month (AEST)

  • 14 April - JPMorgan Chase Q1 earnings

    The first major bank to report. Management commentary on credit conditions, consumer spending, and the macro outlook will set the tone for financial sector earnings and broader market sentiment.

  • 15 April - Bank of America Q1 earnings

    A read on consumer credit conditions and household financial health, particularly relevant given rising energy costs and the 4.4% unemployment rate.

  • 28-29 April - FOMC meeting and policy statement

    The month's most consequential event. The statement and any updated forward guidance may effectively confirm whether rate cuts remain a possibility for 2026.

  • Ongoing - Strait of Hormuz tanker traffic

    A live indicator of energy supply risk. Any escalation or resolution carries immediate implications for oil prices, inflation expectations, and the Fed's options.

  • Ongoing - Sovereign AI export restrictions

    Developing policy around technology export curbs may affect capital expenditure plans for US technology firms, with knock-on implications for growth and employment in the sector.

The Bigger Picture

Geopolitical volatility has forced a rotation into energy and defence at the expense of growth oriented technology positions. The estimated US$650 billion AI infrastructure buildout is increasingly being scrutinised for returns on investment. If earnings season disappoints on that front, and if the FOMC signals a prolonged hold, the combination could test risk appetite heading into May.

Big US data release ahead? Stay focused.
Open an account · Log in
GO Markets
March 30, 2026
Market insights
AI
Top 5 semiconductor stocks in Asia: AI's biggest beneficiaries

Asia dominates the global semiconductor supply. Five companies, spanning Taiwan, South Korea, and Japan, sit at the critical juncture of the AI buildout, controlling everything from fabrication to the equipment that makes chips possible. 

Quick facts

  • TSMC delivered $90 billion in revenue in 2024, with a 59% gross margin and shares up 55% in 2025.
  • Advantest shares doubled (+102%) in 2025 as AI-driven chip testing demand surged.
  • SK Hynix is Nvidia's primary HBM supplier, positioning it at the centre of the AI accelerator boom.

1. Taiwan Semiconductor Manufacturing Co. (TSM)

TSMC is the world's largest contract chip manufacturer, producing advanced semiconductors for Apple, Nvidia, AMD, and Qualcomm. As a pure-play foundry, it leads in 5-nanometer (5nm) and 3- nanometer (3nm) chip production, with smaller nodes in development.

The company posted $90 billion in revenue for 2024 with a 59% gross margin and 36% return on equity. 

Shares delivered a total return of 55% in 2025, with analysts forecasting a further ~30% revenue increase in 2026, underpinned by its $100 billion US expansion programme.

The key risk for the company is its geopolitical exposure, with Taiwan Strait tensions remaining the sector's most-watched tail risk.

What to watch

  • US expansion progress: Any delays, cost blowouts, or political friction concerning TSMC's $100 billion Arizona investment could weigh on sentiment.
  • Customer order visibility: Watch for any guidance updates from Apple, Nvidia, or AMD on chip orders, as TSMC's revenue is highly concentrated among a handful of clients.
  • Geopolitical developments: Any escalation of Taiwan Strait tensions could trigger sharp moves regardless of fundamentals.
  • Next-node ramp: Progress on 2nm production and yield rates will be a key signal for TSMC's ability to maintain its technology lead.

2. Samsung Electronics (KR:005930)

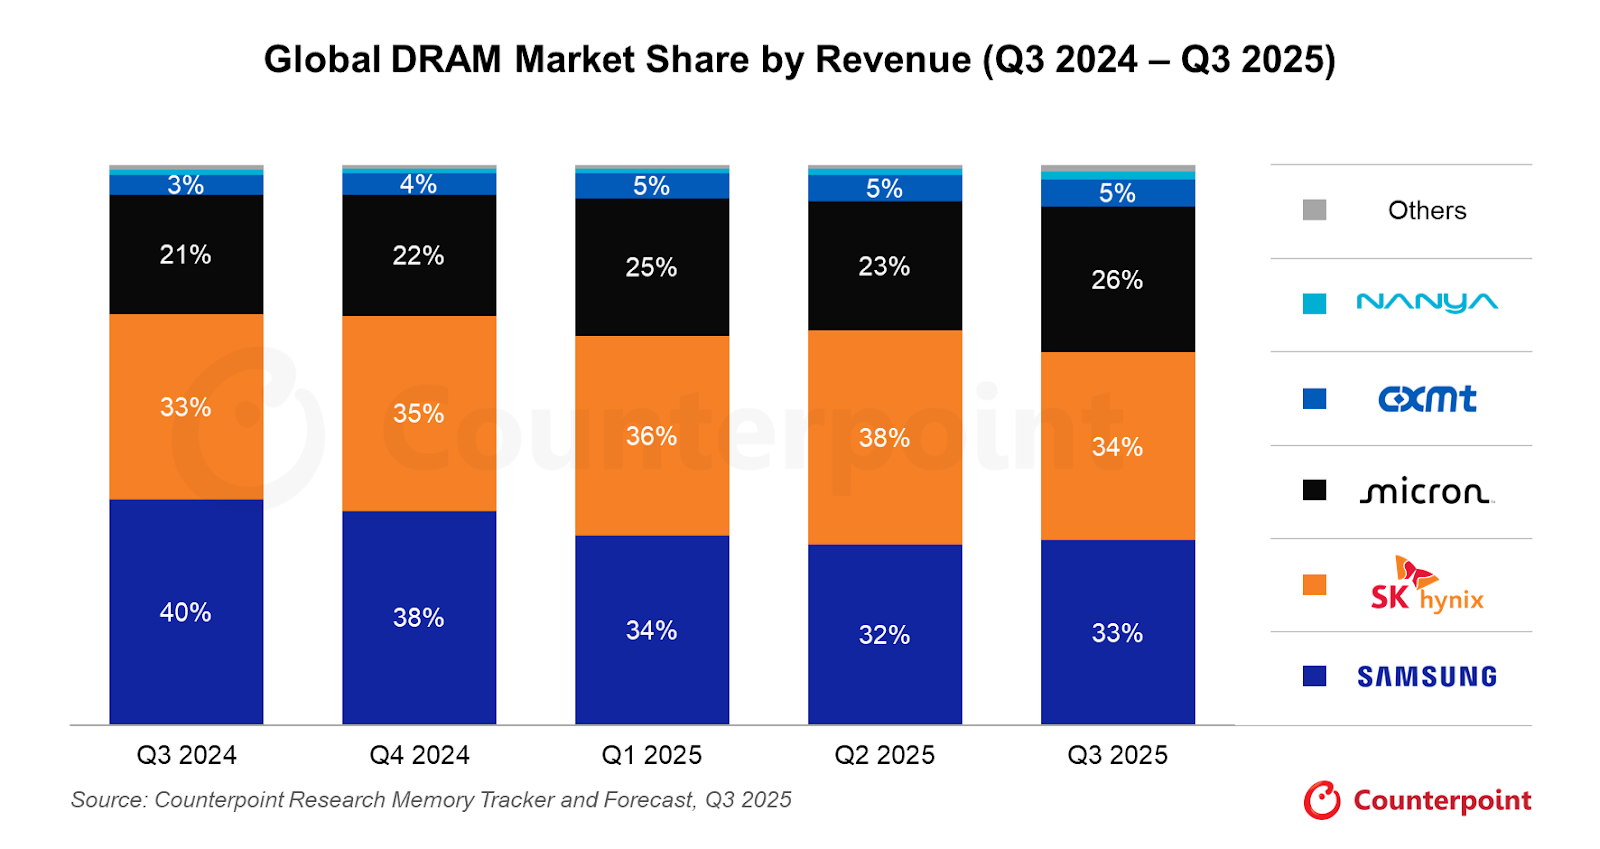
Samsung is one of the few companies globally that both designs and fabricates chips at scale. It competes across DRAM, NAND flash, and logic chip segments, and remains a core supplier to global tech giants.

Samsung's wide scope is a strength, but also a complexity. Its memory division faces margin pressure from inventory cycles, while its foundry business continues to lag TSMC in leading-edge yields. 

The AI-driven memory boom may provide a tailwind, though execution in HBM production has been slower than local rival SK Hynix.

What to watch

  • HBM qualification progress: Samsung has been working to qualify its HBM3E chips with Nvidia. Any confirmation of a major supply win could be a meaningful catalyst.
  • Memory pricing trends: DRAM and NAND spot prices could be an indicator of Samsung's margin trajectory.
  • Foundry yield improvements: Samsung's logic foundry business has struggled with yields at advanced nodes; any credible progress here could re-rate the division.
  • Management guidance: Following a period of earnings volatility, clarity on capex plans and divisional targets at upcoming results will be closely watched.
Source: Counterpoint research

3. Advantest (ATEYY)

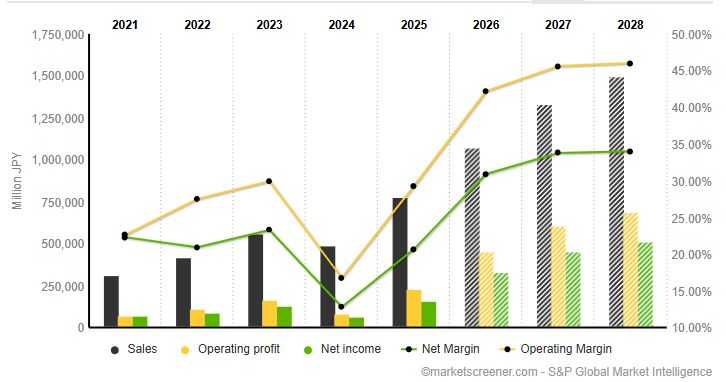
Tokyo-based Advantest makes testing equipment used to verify chips meet performance and quality standards. 

It supplies to Samsung, Intel, Nvidia, Qualcomm, and Texas Instruments, allowing it to benefit from chip industry growth broadly, regardless of which foundry wins market share.

Advantest shares doubled in 2025 (+102%), and it raised its sales forecast by 21.8% and earnings forecast by 70.6% for the year ending March 2026.

What to watch

  • Order backlog updates: Any contraction in Advantest's backlog could be an early warning sign after the strong 2025 run.
  • AI chip testing demand: As chips grow more complex, testing time per chip increases. Monitor whether AI accelerator volumes from TSMC and Samsung start to drive outsized testing demand.
  • FY2026 guidance: The next forecast update will be critical in confirming whether 2025's upgrade cycle has further to run.
Advantest projected income statement | MarketScreener

4. Tokyo Electron (T:8035)

Tokyo Electron is among the world's largest suppliers of semiconductor production equipment, specialising in deposition, etching, and cleaning tools. 

Every major chipmaker, including TSMC, Samsung, and SK Hynix, depends on TEL's systems to scale production.

As chipmakers invest billions to expand capacity, TEL's order book grows. The risk lies in potential US export restrictions on advanced equipment sales to China, which remains one of the primary revenue segments for the company.

What to watch

  • US export control policy: China accounts for a significant portion of TEL's revenue. Any tightening of equipment export rules is the most immediate risk to watch.
  • Chipmaker capex announcements: TSMC, Samsung, and SK Hynix's capital expenditure plans for 2026 directly translate into equipment orders. Any cuts could flow through to TEL's order book.
  • New tool adoption cycles: Monitor whether TEL's next-generation deposition and etch tools are being adopted at leading-edge fabs.

5. SK Hynix (KR:000660)

SK Hynix is the world's second-largest memory chip maker and has emerged as arguably the clearest AI-era beneficiary in the memory space. 

It is Nvidia's primary supplier of High Bandwidth Memory (HBM) chips, the specialised memory used in AI accelerators like the H100 and B200.

HBM demand has driven a dramatic re-rating of SK Hynix's revenue profile and market standing. With AI infrastructure spending showing little sign of slowing heading into 2026, the company's HBM franchise could remain a key differentiator. 

However, capacity constraints and the risk of Samsung and Micron closing the HBM gap are the primary concerns to watch.

What to watch

  • Nvidia supply relationship: Any shift in Nvidia's supplier mix toward Samsung or Micron could be a key risk event.
  • HBM4 development: The race to next-generation HBM is already underway. Watch for updates on SK Hynix's HBM4 readiness and whether it can maintain its lead.
  • Conventional memory pricing: SK Hynix still derives meaningful revenue from standard DRAM and NAND. Spot price trends could be a gauge of the broader memory cycle.

Bottom line

TSMC, SK Hynix, Samsung, Advantest, and Tokyo Electron collectively control the chokepoints of the AI buildout. 

The expected increase in AI infrastructure may support demand, but investors should weigh the risks carefully. 

Geopolitical exposure, US export restrictions, and the pace of HBM competition could all move the needle.

Ready to trade beyond the majors?

Open an account · Log in

GO Markets
March 20, 2026

Disclaimer

References to companies, IPO candidates, valuations, exchanges, sectors and markets are illustrative only, based on publicly available information at the time of publication, and may change without notice. A proposed listing may be delayed, amended or cancelled, and inclusion on this page does not imply that a company will list, or that any share or CFD will be available to trade through GO Markets.