- Trading
- Trading
- Markets
- Markets
- Products
- Forex
- Commodities
- Metals
- Indices
- Shares
- Cryptocurrencies
- Treasuries
- ETFs
- Accounts
- Accounts
- Compare our accounts
- Open account
- Try free demo
- GO Markets Social
- Platforms & tools
- Platforms & tools
- Platforms
- Platforms
- Platforms overview
- MetaTrader 4
- MetaTrader 5
- Mobile trading platforms
- Premium trading tools
- Premium trading tools
- Tools overview
- VPS
- Genesis
- Education
- Education
- Resources
- Resources
- News & analysis
- Education hub
- Economic calendar
- Earnings announcements
- Help & support
- Help & support
- About
- About
- About GO Markets
- Our awards
- Sponsorships
- Client support
- Client support
- Contact us
- FAQs
- Quick support
- Holiday trading hours
- Maintenance Schedule
- Fraud and scam awareness
- Legal documents
- Trading
- Trading
- Markets
- Markets
- Products
- Forex
- Commodities
- Metals
- Indices
- Shares
- Cryptocurrencies
- Treasuries
- ETFs
- Accounts
- Accounts
- Compare our accounts
- Open account
- Try free demo
- GO Markets Social
- Platforms & tools
- Platforms & tools
- Platforms
- Platforms
- Platforms overview
- MetaTrader 4
- MetaTrader 5
- Mobile trading platforms
- Premium trading tools
- Premium trading tools
- Tools overview
- VPS
- Genesis
- Education
- Education
- Resources
- Resources
- News & analysis
- Education hub
- Economic calendar
- Earnings announcements
- Help & support
- Help & support
- About
- About
- About GO Markets
- Our awards
- Sponsorships
- Client support
- Client support
- Contact us
- FAQs
- Quick support
- Holiday trading hours
- Maintenance Schedule
- Fraud and scam awareness
- Legal documents
- Home
- News & Analysis
- Oil, Metals, Soft Commodities
- Crude Oil Opportunities Analysed in 7 Charts
- Home
- News & Analysis
- Oil, Metals, Soft Commodities
- Crude Oil Opportunities Analysed in 7 Charts
 News & AnalysisNews & Analysis
It was only one month ago when oil was the most hated commodity in the market. Analysts were pessimistic and forecasts for oil with a $10 handle were circulating in the financial media.
However, against all odds, oil suddenly managed to hold losses and surprisingly recovered by some 53% from a 12-year low in February. Given this sudden and strong change of direction, the obvious question traders now face is whether the recovery is going to continue.
To be able to answer this question, we should first discuss the chain of historical events that drove oil prices lower and then see if anything is changed.
The Days Of High Oil Prices
The price of oil has significantly increased over the past 18 years. It first went from being $10 a barrel in 1998 to $145 in 2008. This equates to a 1350% return which is way above the 75% return in stocks (represented by S&P500) during the same period.
Then during the Global Financial Crisis, it got sold off heavily and declined by approximately 78% before finding a bottom in late December 2008. Then from 2009 to May 2011, thanks to a global recovery in asset markets and pick up in the global demand, oil outperformed stocks again and rose by 276% to grab everybody’s attention on Wall Street. At this point, oil was only 24% lower than its all-time highs in 2008.
The Technology Behind Oil Production
The prolonged high prices encouraged further investments and developments in production methods previously deemed uneconomical.
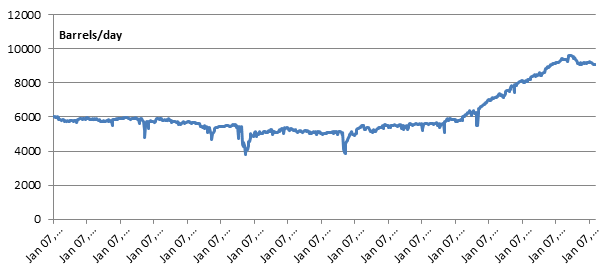
By 2013, not only these methods (namely Shale and Fracking) were profitable but they also helped U.S producers to significantly boost their production capacity. Based on the chart below, oil production in the U.S jumped from an average of 6,200 barrels per day (b/d) in 2012 to an average of 7,400 b/d in 2013 and continued going higher until 2016.
US oil production since 2000
A Race To The Bottom As Oil Price Slips
In the meantime, in response to the threat of new oil supplies from the U.S and to push those competitors (who mainly had higher production costs) out of business, the Persian Gulf oil rich countries, led by Saudi Arabia, decided to pump as much oil as they could to push the oil prices lower and keep their market share.
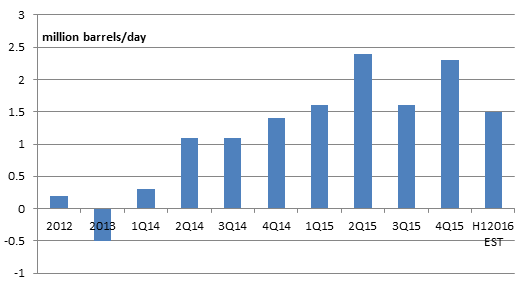
The combination of the above factors flooded the markets with so much oil that the world’s total daily supply exceeded the demand by a considerable amount. In January 2016, the International Energy Agency (IEA) warned that the world could “drown in oil” and markets may be left with a surplus of 1.5 million barrels a day in the first half of 2016.
Average Daily Oil Surplus per quarter since 2012
The imbalance between supply and demand created such pressure that not only the price of oil dropped against USD, but according to the chart below, it significantly dropped against other major currencies as well.
Oil vs. Major Currencies
Red line: oil in USD, Blue line: oil in Yen, Green line: oil in Euro and the black line is oil in AUD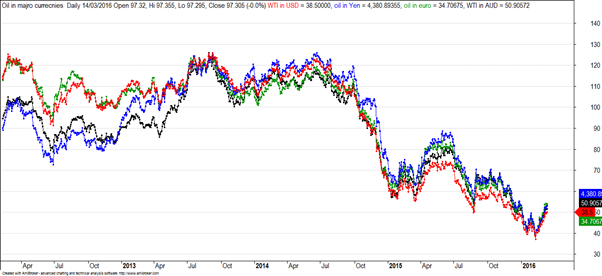
The Price ReversalNo trend can last forever in the financial markets. At some stage during the life of any trend, prevailing market drivers will be replaced by new drivers that not only stop the trend but they reverse it.
In the case of oil, extremely low prices seem to have finally started to push higher oil producers (e.g. Shale oil companies) out of business. In their most recent report, the IEA suddenly changed their tone and said they now estimate that production outside of the Organization of Petroleum Exporting Countries (including the US) will decline by 750,000 barrels a day due to lower oil prices. Less production is exactly the force needed to stop and reverse the bearish trend.
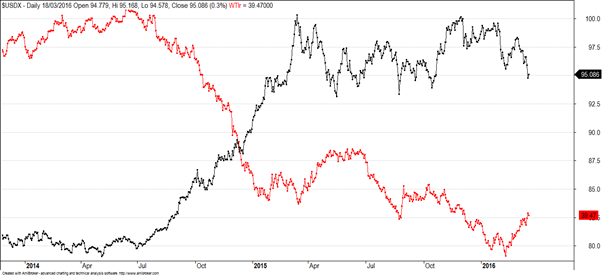
U.S dollar coming off from its highs in both February and March was another factor that helped oil. Traditionally, commodities are measured against the greenback, so any weakness in USD will naturally put upward pressure on them.
Oil (the red line) vs. U.S Dollar (the black line)
How far can the oil rally go?
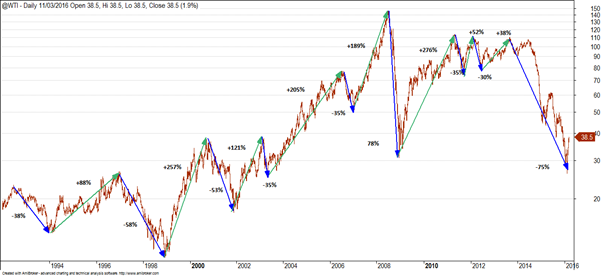
To answer this question, let’s take a look at the chart showing oil‘s major historical swings since 1992. Eye catching in this chart is GFC’s 78% downwards move followed by a 276% rise.
Collectively, between 2013 highs to the February 2016 lows, oil dropped by some 75% which is almost similar in size to the down move seen during the GFC. Whilst the size of the current move is similar to the GFC, it doesn’t make much economical sense to compare the aftermath of the GFC with the current situation, and target another +276% price increase.
Post GFC, asset markets in general embarked on a massive price appreciation wave driven by trillions of dollars of stimulus packages across the world. We don’t have the luxury of those market aids these days.
If you exclude the GFC and get an average of the size of the uptrends that immediately followed pullbacks of 35% or more since 1992, you will get an average recovery rate of 151% from the downtrend lows.
If you apply this recovery rate to the closing price of the February low, you would get a target price of $65.16 which is only $3 shy of 50% Fibonacci retracement line drawn between 2013 high and the February low. Therefore, oil seems to have a fair bit to go.
Daily WTI Crude Oil Closing prices
Impact of Oil on Equities
Usually higher oil prices equate to higher input costs that in turn lead to lower profit margins which is obviously not a good thing for the equity markets. This time however, it is different and higher oil prices are actually supportive of the stock markets.
The reason behind this is that during the crash days, investors got nervous about probable bankruptcies in the energy sector and their follow-on impact on the overall market. The energy sector is very capital intensive in nature and companies usually take on large amounts of debt to carry on their operations.
In the face of the sharp decline in oil and gas prices, these companies went under tremendous pressure to service their debts. Market noticed this pressure in mid-2015 and started pricing a wave of defaults amongst the energy sector. The fear of a potential credit crisis pushed up the correlation between stocks and oil to a degree that the pair started to move in lock steps from November 2015 up to now.
Higher oil price takes some pressure off the oil companies and helps markets restore confidence. Therefore, for now, higher oil is a good thing for equity investors.
Stocks and Oil moving together since November 2015
Red line: oil, Black line: S&P500, Blue line: ASX 200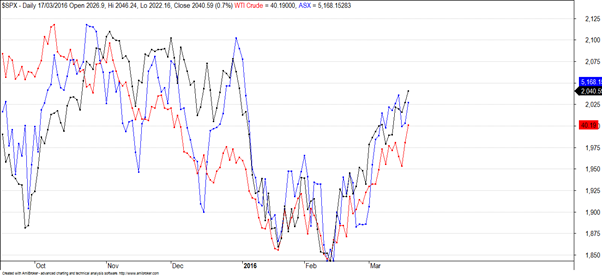
Impact of Oil on the Australian dollar
Higher oil price can positively impact the Australian dollar on two fronts. First, as discussed earlier, higher oil can restore confidence back to the markets and can create a risk on environment. Given that the Aussie dollar is mainly accounted as a risk on asset, higher oil can be supportive of the AUD (please refer to our last month’s article for a detailed explanation of risk on/off status).
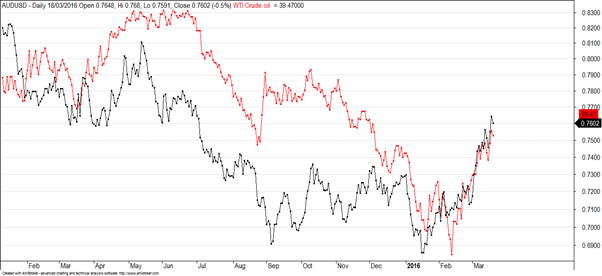
Second, being a commodity driven currency, the Australian dollar has a direct relationship with commodities, including oil. The chart below shows AUD and oil. As you can see, the pair is highly correlated. Further up moves in oil can take Aussie higher.
AUD (black line) vs. oil (the redline)
The Headwinds
As discussed throughout this article, at the moment, the main driving force behind oil prices is coming from the supply side. Any new piece of information that explicitly or implicitly implies a production cut (increase) will immediately benefit (hit) oil significantly.
Since Iran’s sanctions were lifted in late 2015, it has been desperately trying to increase daily production by 1 million barrels a day (b/d) to get back to pre-sanction levels of 4 million b/d. So far, Iran’s production increase has been slower than predicted.
However, any future news on Iran’s success to increase production is likely to have severe price implications on oil.
What are the trading opportunities on Crude Oil?
Taking a look at the Light Crude Oil contract on a weekly chart, it is amazing to see the journey it has taken since mid-2014. The initial drop in the first 34 weeks saw an incredible 57% of the value wiped off the contract, dropping from around $107 to $45.
It goes without saying, the trend is down but the recent price action on the weekly chart has seen the price pop its head above the longer term moving average. In this case, we are using a 26 period moving average on the weekly chart.
The key thing to note on the weekly chart is the successive lower highs and lower lows, and despite the impressive rebound over the last 6 weeks, Crude has been unable to break old highs.
So right now, the weekly chart is well and truly showing overbought in the midst of a very strong downtrend. We can also see 2 lines of support/resistance around the $40 level and the $45 mark. As we write this, Crude has broken above the first level of resistance and looks like a continuation in place to target the $45 level.
We are seeing some distributive selling over the last 2 weeks, as nervous longs take profits off the back of this nice rally.
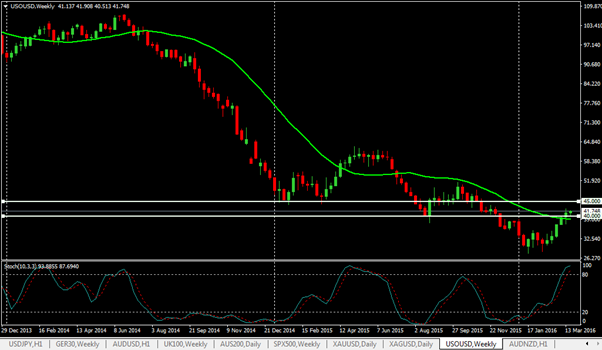
On the daily chart (shown below) we can see some previous highs getting broken and the lows rising as well. This is a positive sign in the short term, but all traders should keep aware of the bigger picture and identify the potential trading opportunities accordingly.
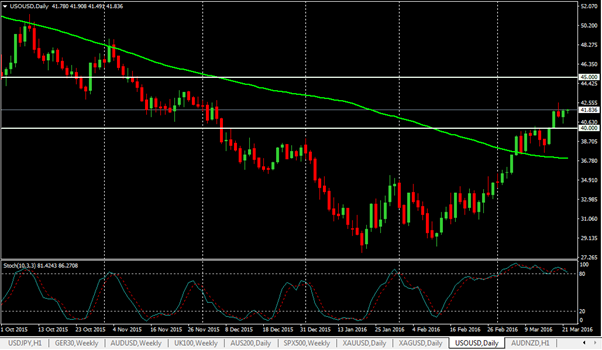
Generally speaking, we look for two key factors, which are time and price. Right now we have had a lot of price movement in a short space of time. Crude has the potential to consolidate at current levels whilst time catches up.
It would not be unusual to see price hover around the $40-$42.50 mark for a few weeks before this next major move is underway. Having said that, we are talking about one of the most volatile and active contracts of 2015-2016, so predictions are considerably challenging at best.
You will notice the stochastics indicator showing overbought on the daily chart as well but the chart continues to hit higher highs. In addition, we are starting to see some bearish divergence as price heads higher but the stochastics slowly trends lower. Divergence is usually one of the most powerful signals in the market, so short term traders will be well advised to keep an eye on how that plays out.
What are the prospects for the AUDUSD?
The Aussie dollar has been one of the surprise packets in early 2016 as it tracked lower at an alarming rate, with an impressive push lower right on the New Year period. In all fairness, it seemed like all the global markets were crashing then as well, but fortunately our Aussie battler managed to find some support and rally off those newly established lows.
Given Australia’s ability to dig natural resources out of the ground and sell them internationally, it comes as no surprise to see the AUD rising this quickly when we consider how strong Iron Ore, Crude and Gold have been since the start of 2016.
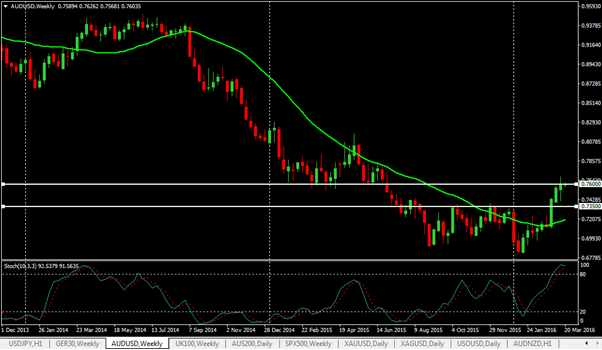
So the weekly chart shows the AUD breaking new recent highs, hitting higher highs and successive higher lows. In the short to medium term this bodes well.
If we take a look at the support and resistance lines, you can see resistance is pressuring the AUD around the 0.7600 mark with plenty of distributive selling happening over the last 2 weeks, much like we saw in the price of Crude. This resistance extends back to early 2015 and again in mid-2015, so there is plenty of reason to keep a very close eye on current levels and tighten your trailing stops or wait for a pullback for potential long entries.
We also notice the stochastics is showing overbought, but do note that in an uptrend, the stochastics will always show overbought as it is plotting where is today’s close in relation to the high and low over the last 10 periods.
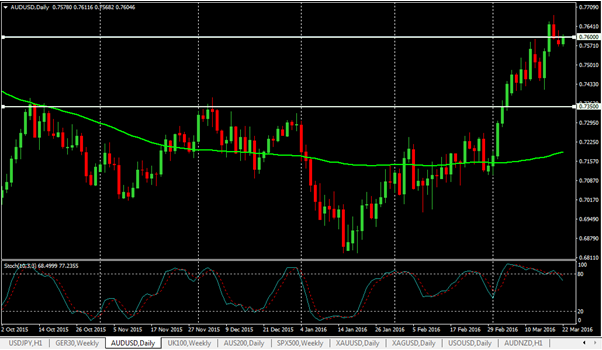
On the daily chart you can see clearly the resistance levels that the AUD has powered through, taken no prisoners for those who may have been short. It is likely the sheer volume of those short the AUD that had to cover (buy back the AUD), resulting in the rapid escalation to the 0.7600 level. There is no doubt for those who played the emotions of the market during this time, that they would have been smiling and are likely to still be smiling.
Poking its head above the 0.7600 mark has produced a bevy of interested profit takers, taking money off the table, following a hand 250+pip run in 10 trading days. Remember, we mentioned on the weekly notes above how many times this level formed support previously, only to be broken at the middle of last year.
In addition, we can see some bearish divergence on the daily chart with the stochastics trending lower from well overbought.
Right now the short and medium term trend is up, so best not to fight with that. The longer term 100 period moving average has also started to trend higher, so traders will want to pay attention there as well.
Given the strong move in such a short space of time, it would not be a bad thing to see the market pull back and provide a potentially handy level of entry to the long side. Having said that, momentum is favouring the bulls, so bargain hunters may not get a chance at a lower price for entry.
The opinions and information conveyed in the GO Markets newsletter are the views of the author and are not designed to constitute advice. Trading Forex and CFD’s, including Crude Oil trading, is high risk.

Ramin Rouzabadi (CFA, CMT) | Trading Analyst Ramin is a broadly skilled investment analyst with over 13 years of domestic and international market experience in equities and derivatives.
With his financial analysis (CFA) and market technician (CMT) background, Ramin is adept at identifying market opportunities and is experienced in developing statistically sound investment strategies.
Ramin is a co-founder of exantera.com which is a financial website dedicated to risk analysis and quantitative market updates.Ready to start trading?
Disclaimer: Articles are from GO Markets analysts and contributors and are based on their independent analysis or personal experiences. Views, opinions or trading styles expressed are their own, and should not be taken as either representative of or shared by GO Markets. Advice, if any, is of a ‘general’ nature and not based on your personal objectives, financial situation or needs. Consider how appropriate the advice, if any, is to your objectives, financial situation and needs, before acting on the advice. If the advice relates to acquiring a particular financial product, you should obtain and consider the Product Disclosure Statement (PDS) and Financial Services Guide (FSG) for that product before making any decisions.
Next Article
Trading Tools: Trading Central
Imagine having access to technical analysis across all the major markets, updated around the clock in real-time and of the same calibre that investment banks around the world receive daily. Then consider having all your favourite Forex and Commodity markets analysed with a trade entry, exit, profit taking levels and a price projection. And what i...
March 23, 2016Read More >Previous Article
Bank of Japan opts for negative interest rate, but Yen soars
Just days before Japan’s unexpected negative rate announcements, the country’s central bank chief Haruhiko Kuroda was quoted in an interview where...
February 24, 2016Read More >
