- Trading
- Trading
- Markets
- Markets
- Products
- Forex
- Commodities
- Metals
- Indices
- Shares
- Cryptocurrencies
- Treasuries
- ETFs
- Accounts
- Accounts
- Compare our accounts
- Open account
- Try free demo
- GO Markets Social
- Platforms & tools
- Platforms & tools
- Platforms
- Platforms
- Platforms overview
- MetaTrader 4
- MetaTrader 5
- Mobile trading platforms
- Premium trading tools
- Premium trading tools
- Tools overview
- VPS
- Genesis
- Education
- Education
- Resources
- Resources
- News & analysis
- Education hub
- Economic calendar
- Earnings announcements
- Help & support
- Help & support
- About
- About
- About GO Markets
- Our awards
- Sponsorships
- Client support
- Client support
- Contact us
- FAQs
- Quick support
- Holiday trading hours
- Maintenance Schedule
- Fraud and scam awareness
- Legal documents
- Trading
- Trading
- Markets
- Markets
- Products
- Forex
- Commodities
- Metals
- Indices
- Shares
- Cryptocurrencies
- Treasuries
- ETFs
- Accounts
- Accounts
- Compare our accounts
- Open account
- Try free demo
- GO Markets Social
- Platforms & tools
- Platforms & tools
- Platforms
- Platforms
- Platforms overview
- MetaTrader 4
- MetaTrader 5
- Mobile trading platforms
- Premium trading tools
- Premium trading tools
- Tools overview
- VPS
- Genesis
- Education
- Education
- Resources
- Resources
- News & analysis
- Education hub
- Economic calendar
- Earnings announcements
- Help & support
- Help & support
- About
- About
- About GO Markets
- Our awards
- Sponsorships
- Client support
- Client support
- Contact us
- FAQs
- Quick support
- Holiday trading hours
- Maintenance Schedule
- Fraud and scam awareness
- Legal documents
- Home
- News & Analysis
- Shares and Indices
- Nike tops Wall Street estimates
- 1 Month -4.73%
- 3 Month -18.03%
- Year-to-date -33.70%
- 1 Year -27.47%
- Cowen & Co. $133
- Deutsche Bank $152
- Credit Suisse $130
- Citigroup $123
- Baird $150
- UBS $168
- Morgan Stanley $159
- HSBC $132
- Wells Fargo $150
News & AnalysisNike Inc. (NKE) reported its latest financial results for its fiscal 2022 fourth quarter after the closing bell in the US on Monday. World’s largest sporting goods company topped both revenue and earnings per share estimates.
The company reported revenue of $12.234 billion for the quarter vs. $12.061 billion expected.
Earnings per share reported at $0.90 per share vs. estimate of $0.80 per share.
”NIKE’s results this fiscal year are a testament to the unmatched strength of our brands and our deep connection with consumers,” John Donahoe, President and CEO of Nike said in a press release after the results.
”Our competitive advantages, including our pipeline of innovative product and expanding digital leadership, prove that our strategy is working as we create value through our relentless drive to serve the future of sport,” Donahoe added.
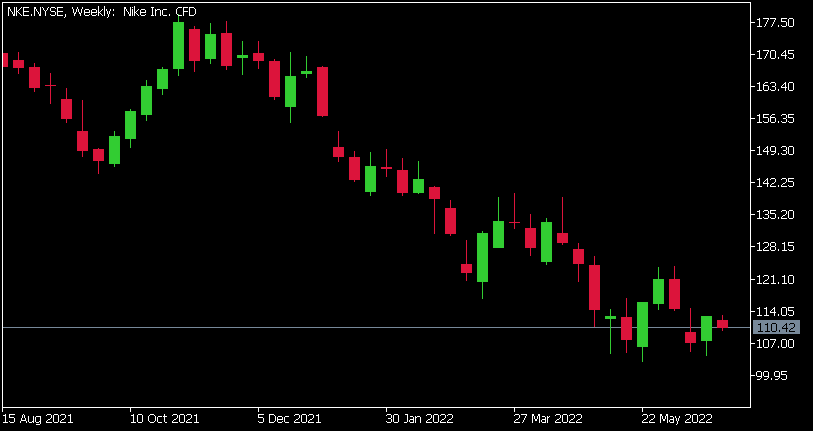
Nike Inc. (NKE) chart

Shares of Nike were down by around 2.13% at the end of trading day on Monday at $110.42 per share.
Here is how the stock has performed in the past year:
Nike price targets
Nike Inc. is the 61st largest company in the world with a market cap of $173.90 billion.
You can trade Nike Inc. (NKE) and many other stocks from the NYSE, NASDAQ, HKEX and the ASX with GO Markets as a Share CFD.
Sources: Nike Inc., TradingView, MarketWatch, Benzinga, CompaniesMarketCap
Ready to start trading?
Disclaimer: Articles are from GO Markets analysts and contributors and are based on their independent analysis or personal experiences. Views, opinions or trading styles expressed are their own, and should not be taken as either representative of or shared by GO Markets. Advice, if any, is of a ‘general’ nature and not based on your personal objectives, financial situation or needs. Consider how appropriate the advice, if any, is to your objectives, financial situation and needs, before acting on the advice. If the advice relates to acquiring a particular financial product, you should obtain and consider the Product Disclosure Statement (PDS) and Financial Services Guide (FSG) for that product before making any decisions.
Next Article
Australian Gold companies slump to yearly lows
Some of Australia’s largest gold miners have slumped to their 52-week price lows as rising costs and labour shortages have pushed their share prices down. St Barbara, (SBM), Ramelius Resources, (RMS) and now Evolution Mining, (EVN) have all reported disappointing updates to the market. The collective weakness has reverberated across the sector wi...
June 29, 2022Read More >Previous Article
The Week Ahead – Stock Markets
After weeks of relentless selling the market provided a decent rally to end the week. The S&P 500 saw a nice jump rising 3.44% during Friday’s t...
June 27, 2022Read More >

