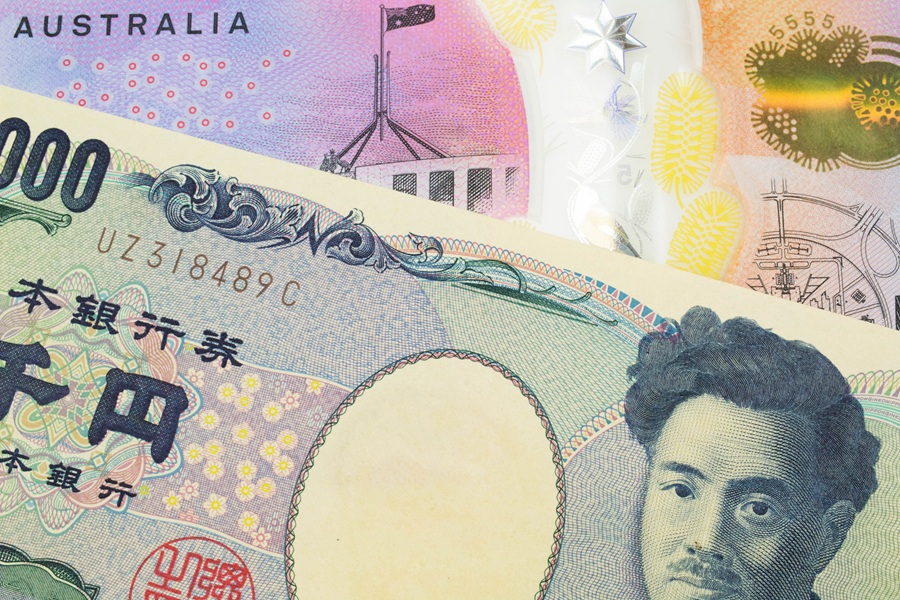
RBA hikes vs BOJ holds: what does the widening AUD/JPY divergence mean for traders?
GO Markets
5/5/2026
•
0 min read
Share this post
Copy URL
This afternoon, the Reserve Bank of Australia (RBA) did what plenty of forecasters had pencilled in, but few quite believed would actually arrive. It lifted the official cash rate by another 25 basis points (bps) to 4.35 per cent.
Across the water in Tokyo, the Bank of Japan (BOJ) is still sitting at 0.75 per cent, with Governor Ueda fielding three dissenting board members and asking everyone to be patient.
That leaves the interest rate gap between Sydney and Tokyo at 360 bps, the widest it has been in this cycle. And that gap is not just an economic footnote. It is the fuel behind one of the world’s most popular, and most accident-prone, trades in currency markets: the Yen carry trade.
This is where the story gets interesting.
Quick refresher: what is a carry trade?
A carry trade is when investors borrow money in a country with very low interest rates and park it in a country with higher ones. The Japanese yen has been the world’s favourite borrowing currency for years, mostly because Japanese rates were pinned near zero for a generation.
Borrow yen at 0.75 per cent, buy Australian dollars yielding 4.35 per cent, and investors may collect the difference. When the AUD is stable or rising, the trade can look wonderfully simple. When it turns, it can become brutally complicated.
That is the mechanism and now... to put it on a chart.
Policy rate paths: RBA vs BOJ (Nov 2025 to May 2026)
RBA cash rateBOJ policy rate
The RBA has resumed hiking while the BOJ has held since January, leaving the gap between the two cash rates at its widest point of the current cycle. This divergence remains a fundamental driver for AUD/JPY carry trade dynamics.
You can see why traders are paying attention. The green line keeps stepping up. The dashed line has gone flat since January. That fan-out is the story in one picture.
But the chart only tells half of it. The other half is why these two central banks have ended up in such different places.
Two banks, two different problems
The RBA is not raising rates because the economy is humming along, rather, it is raising them because petrol has crossed 240 cents a litre and Governor Bullock has decided imported energy inflation cannot be ignored.
The BOJ, meanwhile, would dearly like to hike to defend a yen flirting with the 160 mark against the US dollar. The problem is that it is also wary of upsetting a Nikkei 225 sitting near record highs around 60,000.
So the BOJ waits, the RBA acts, and AUD/JPY becomes one of the cleaner expressions of the gap.
The headline divergence is one thing. The carry now on offer is where things start to bite.
RBA minus BOJ rate spread (basis points)
Rate SpreadCycle High
The carry available to a long AUD, short JPY position has widened by 50 basis points in six months. This structural divergence creates one of the most significant yield-seeking opportunities in G10 currency pairs heading into mid-2026.
A 50 bps widening in six months is not small. It changes how attractive the trade looks on a yield basis. More importantly, it changes how many traders may be sitting in the same position.
And crowded trades have a habit of looking calm right up until they do not.
Why the CFD angle matters
This is not just a macro story sitting on a central bank noticeboard. It can show up directly in the prices on a CFD trader’s screen, and it may change how several common instruments behave at once.
Start with leverage. Contracts for difference (CFDs) amplify both sides of a wider rate gap: the slow grind higher and the sudden snap lower.
Then there is overnight financing, which broadly reflects the rate differential between the two currencies. With the gap now at 360 bps, a long AUD/JPY position may have positive overnight financing, while a short position may pay it. That does not make long AUD/JPY the right trade. It simply means the cost profile has changed.
The divergence also radiates outward. Nikkei 225 CFDs can ride the weak-yen tailwind, but may take a hit if the Yen strengthens on intervention chatter. Gold CFDs can also catch a bid when carry positions unwind. USD/JPY around 160 is the chart the Ministry of Finance is likely to care about, and a break there could pull the yen higher against more than just the dollar.
That is the honest summary: a widening rate gap does not hand CFD traders a trade. It hands them a regime where the opportunity looks bigger, but so does the trapdoor.
Manage your catalysts
Prepare for upcoming events and review your approach before trading.
The immediate base case is fairly tame. AUD/JPY could drift higher as traders price the wider gap and the Australian dollar finds support from today’s hike. An upside acceleration could come from softer yen positioning and steady risk appetite.
However, tame does not mean safe. A rate check by Japan’s Ministry of Finance, often the warning shot before actual currency intervention, could trigger a sharp yen rally and force carry positions to unwind.
Short-term Watchlist
USD/JPY behaviour around 160
MoF intervention commentary
Australian petrol prices
Heading into 16 June: Double Decision Day
The headline event is 16 June, when the RBA and BOJ deliver decisions on the same day. While the most likely outcome is a “no surprise” hold from both, markets rarely wait politely.
An upside scenario for AUD/JPY would be a hot Australian inflation print on 27 May that supports a hawkish RBA posture. Conversely, any shift in BOJ language towards earlier normalisation could compress the spread quickly. Margin settings can also vary around major events, making the calendar a key influence on trade behaviour.
The Upside Trigger
A hot Australian inflation print on 27 May supports a hawkish RBA posture.
The Fade Risk
A shift in BOJ language towards earlier normalisation narrows the spread.
The August Outlook
By August, the picture may look different. If oil cools and Australian inflation softens, the 4.35 per cent rate may turn out to be the cycle peak. The base case from there is a slow narrowing of the gap as the BOJ inches higher.
The uglier path is a global growth scare that lifts the yen as a safe haven, forcing positions to unwind regardless of interest rate maths. This is the uncomfortable truth: the maths can look tidy, but the exits can get messy.
The psychological trap to watch for
Rate divergence stories feel mathematically clean. The numbers can suggest a currency should appreciate, traders pile in, and the chart obliges. Then one intervention headline lands, the move reverses in 20 minutes, and stops are hit at the worst available price.
The bias to watch is carry complacency, the assumption that because the trade has worked for months, it will keep working. That is usually when the market becomes least forgiving.
A risk question for traders is simple: if this pair moved 3 per cent in the wrong direction overnight, would the position size still be reasonable? If the answer is no, that may say more about sizing than the trade view.
Bottom line
What traders may want on the radar: watchlists that reflect the divergence, broker swap rates and margin policies, and a clear view on what level of volatility they are prepared to sit through.
Though the carry story has momentum, it also has a tripwire and the next move may depend on which one markets notice first.
Watching Asia-Pacific moves today?
Track Asia-Pacific themes and monitor moves as they unfold with our institutional-grade tools.
The information provided is of general nature only and does not take into account your personal objectives, financial situations or needs. Before acting on any information provided, you should consider whether the information is suitable for you and your personal circumstances and if necessary, seek appropriate professional advice. All opinions, conclusions, forecasts or recommendations are reasonably held at the time of compilation but are subject to change without notice. Past performance is not an indication of future performance. Go Markets Pty Ltd, ABN 85 081 864 039, AFSL 254963 is a CFD issuer, and trading carries significant risks and is not suitable for everyone. You do not own or have any interest in the rights to the underlying assets. You should consider the appropriateness by reviewing our TMD, FSG, PDS and other CFD legal documents to ensure you understand the risks before you invest in CFDs. These documents are available here. Any references to Australian or international shares, sectors, indices, ETFs, crypto-related stocks or other instruments are provided for market commentary and watchlist purposes only and do not constitute a recommendation, offer or solicitation to buy, sell or hold any financial product or adopt any investment strategy. International markets may involve additional risks, including currency fluctuations, regulatory differences, market structure differences, reduced liquidity and higher volatility. Company-specific, sector-specific and macroeconomic risks may also affect performance.
Commentary on geopolitical developments, economic data, central bank decisions, earnings, policy changes and other global or financial market events is based on information available at the time of publication and may change without notice. Such events can lead to sudden market moves, price gaps, reduced liquidity, wider spreads and increased volatility, particularly in leveraged products such as CFDs. Forward-looking statements, expectations and scenario analysis are inherently uncertain and should not be relied on as guarantees of future market behaviour or outcomes.

This is the second part of the GO Markets VIX Playbook. The first piece covered the basics and explored what the VIX measures, what it does not, why traders watch it and where new traders most often misread it. If you skipped it, start there as the foundation matters.
Tuesday, 12 May 2026, at roughly 7:30 pm AEST, Treasurer Jim Chalmers will stand up in Canberra and deliver the 2026-27 Federal Budget. According to Budget.gov.au, that is when the Budget is officially released, with the Budget papers going live online at the same time.
For US retailers and consumer brands, the first hit is usually margin. Import costs rise before pricing power does. Companies can try to pass those costs on, but customers may resist higher prices, especially if household budgets are already stretched. Existing inventory can also soften the first blow, which means the initial earnings result may look manageable while the next one carries the real pressure.
Tariffs, earnings and the Asia versus US split | GO Markets
Same tariff. Different earnings hit.
That is the key split for traders watching this earnings season. The US side is mainly about margin timing. The Asia side is about demand sensitivity. Not every export sector carries the same level of US demand risk.
TL;DR
US companies may face margin pressure as tariffed inventory moves through earnings.
Asian exporters may face volume pressure if US buyers reduce orders.
The timing is different: US retailers may feel the impact later, while Asian exporters may see it earlier through weaker order books.
Textiles, apparel and basic consumer goods are likely more sensitive to US demand.
Semiconductors and AI hardware may be less directly exposed to US consumers, but still carry policy, capex and valuation risk.
The big picture
Tariffs are paid at the US border by importers. From there, the cost can move through the system in several ways: higher prices, weaker margins, lower supplier prices, lower demand or a mix of all four.
Research cited by the Kiel Institute and New York Fed suggests US buyers and businesses may be absorbing a significant share of the tariff burden. That matters because it changes where the earnings pressure shows up first.
For a US retailer, the problem is straightforward but uncomfortable. If the company raises prices, demand may weaken. If it absorbs the tariff cost, margins may compress. If it still has older inventory, the hit may not show up immediately.
For an Asian exporter, the pressure can arrive through a different channel. If US buyers become cautious, they may order less. The exporter may keep prices relatively stable, but factory utilisation falls, fixed costs are spread across fewer units and earnings pressure builds.
That is why this is not just a tariff story. It is an earnings timing story.
US companies: the margin problem
The US side of the tariff story is about cost absorption.
Retailers, apparel brands, consumer electronics sellers and appliance companies often rely on imported goods, components or packaging. When tariff costs rise, they may try to protect margins through price increases, supplier negotiations, sourcing changes or inventory management.
The challenge is that none of these are clean solutions.
Price increases can test consumer demand. Supplier negotiations may take time. Sourcing changes can be expensive or slow. Inventory timing can make the first result look better than the underlying cost trend.
This is why earnings calls matter. Management commentary around pricing actions, tariff mitigation, sourcing, vendor negotiations and inventory timing may reveal more than headline sales growth.
What to watch on the US side
These signals may provide useful context in upcoming earnings reports:
If margins hold while sales remain stable, companies may be managing the pressure. If sales rise but margins fall, tariff costs may not be passing through cleanly. If guidance becomes more cautious, the market may start pricing a delayed earnings impact.
Asian exporters: the volume problem
The Asia side is not always about exporters cutting prices.
In many categories, Asian suppliers operate in competitive global markets with limited pricing power. If US buyers reduce orders, exporters may feel the impact through lower volumes rather than lower unit prices.
That distinction matters.
A company can report stable prices and still face earnings pressure if factories are running below normal utilisation. Lower volumes can reduce operating leverage, delay capital expenditure and weaken guidance.
The highest-risk sectors are usually those most closely tied to US retail demand, seasonal buying cycles and low-margin production.
Which Asian sectors are most exposed?
1. Textiles and apparel +
Highest Sensitivity
Textiles and apparel are among the clearest examples of US demand exposure.
These exporters are often tied directly to US retail orders, private-label contracts and seasonal buying cycles. If US retailers turn cautious, orders can be delayed, reduced or cancelled relatively quickly.
Risk is higher because margins are often thin, production is labour-intensive and buyers may have more power in negotiations.
Relevant export markets: Vietnam, Bangladesh, India, Indonesia and parts of China.
2. Basic consumer goods +
High Sensitivity
This includes toys, household goods, furniture, simple appliances and other discretionary or semi-discretionary exports.
These categories are exposed when US retailers reduce inventory or when consumers pull back from non-essential spending. Tariffs can add pressure if buyers try to push costs back onto suppliers.
Relevant export markets: China, Vietnam, Thailand, Malaysia and Indonesia.
3. Electronics assembly +
Medium to High Sensitivity
Electronics assembly is more mixed.
Lower-end consumer electronics can be sensitive to US household demand. Higher-value components or enterprise-linked electronics may be more resilient, depending on end-market exposure.
This sector can also be harder to read because supply chains are complex. A company may look like a technology exporter, but its actual earnings sensitivity may still depend on US consumer replacement cycles.
Relevant export markets: China, Vietnam, Malaysia, Thailand, Taiwan and the Philippines.
4. Machinery and industrial goods +
Medium Sensitivity
Machinery is less directly tied to US consumer demand than apparel or household goods. The risk is more about business investment.
If US companies delay capital expenditure because tariff uncertainty rises, machinery orders may weaken. However, order books can provide some buffer, and specialised products may have more pricing power.
Relevant export markets: Japan, South Korea, China, Taiwan and Singapore.
5. Semiconductors +
Lower Direct Sensitivity
Semiconductors are less directly exposed to US retail demand than textiles or consumer goods. Demand is often tied to broader technology cycles, autos, industrials, cloud infrastructure and AI investment.
That does not make the sector risk-free. Tariffs, export controls, geopolitics and a weaker global capex cycle can still affect earnings expectations.
Relevant export markets: Taiwan, South Korea, Malaysia, Singapore and parts of China.
6. AI hardware and data-centre supply chains +
Lowest Direct Sensitivity
AI hardware is more tied to cloud capital expenditure and data-centre buildouts than day-to-day consumer spending.
The risk is different. It is less about US shoppers buying fewer goods and more about whether AI capex expectations remain realistic, whether policy restrictions expand and whether valuations already price in strong growth.
Relevant export markets: Taiwan, South Korea, Malaysia and advanced electronics supply-chain hubs.
A simple sector risk map
Sensitivity Analysis
Indicative Asian exporter sensitivity to US consumer demand
Note: This is a general framework only. Sensitivity may vary by company, customer mix, contract structure and end market exposure.
Why timing matters
The US and Asia timelines may not line up.
A US retailer may still be selling older inventory, so the tariff impact can be delayed. Margins may hold in one quarter, then weaken as new tariffed inventory becomes a larger share of the sales mix.
An Asian exporter may see the pressure earlier if US buyers reduce orders before the cost hit appears in US consumer prices.
That creates a split earnings map:
US side: delayed margin pressure.
Asia side: earlier volume pressure.
Policy side: tariff exemptions, pauses or escalations can change the setup quickly.
The mistake is assuming a clean and immediate tariff impact. A strong US retailer result does not automatically mean tariff pressure is gone. It may only mean older inventory is still flowing through. A stable Asian exporter margin does not automatically mean demand is healthy. Volumes may be weakening beneath the surface.
The trap in the earnings season
What to watch next
On the US side, gross margins, inventory commentary, same-store sales and second-half guidance may provide useful context.
On the Asia side, export volumes, factory utilisation, order backlogs, working capital and capital expenditure guidance may be more relevant.
Across both regions, tariff policy remains the swing factor. Exemptions, pauses or new restrictions could quickly change market expectations.
Sector charts may provide additional context on whether market pricing is aligning with the earnings narrative, but they should be read alongside company commentary and macro data from the economic calendar.
FAQ
Frequently asked questions
How do tariffs affect US companies and Asian exporters differently? +
Tariffs may affect US companies through margin pressure and Asian exporters through volume pressure. US companies may face higher import costs, while Asian exporters may face fewer orders from US buyers.
Which Asian export sectors are most exposed to US demand? +
Textiles, apparel and basic consumer goods are generally more exposed to US demand because they are closely tied to retail orders and consumer spending. Electronics assembly and machinery are moderately exposed, while semiconductors and AI hardware may be less directly exposed.
Why can tariff impacts show up later in retailer earnings? +
Retailers may still be selling older inventory purchased before tariffs applied. The impact may become more visible later as new tariffed inventory moves through sales and margins.
What should investors watch in tariff-related earnings reports? +
General signals include gross margins, inventory commentary, same-store sales, export volumes, factory utilisation, order backlogs and management commentary on pricing or sourcing.
Are semiconductors and AI hardware exposed to tariffs? +
They may be less directly exposed to US consumer demand, but they can still be affected by policy restrictions, export controls, global capex cycles and valuation expectations.
Bottom Line
The tariff story is no longer only about who pays. It is about where the earnings pressure shows up first.