Most people think Nvidia got lucky with AI. They made chips that were good for gaming, and it turned out those same chips were good for machine learning.But that's not what happened at all…What actually happened reveals a fundamental misunderstanding of technology markets, and why investors often misread them.
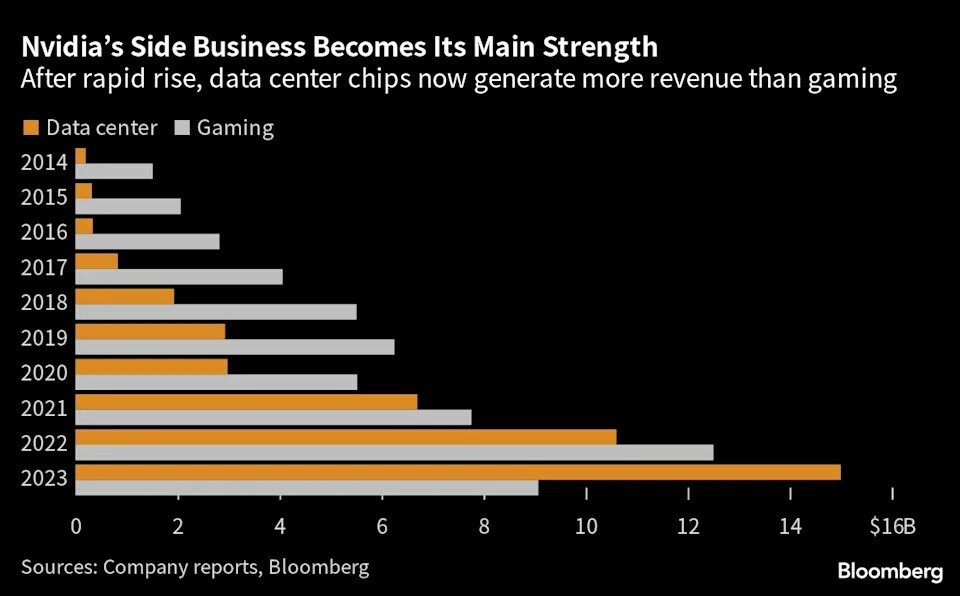
Nvidia’s data center revenue flipped gaming in 2023
Why Markets Misread Platform Plays
Markets consistently undervalue platform investments while they're being made, then overvalue them once they succeed. Platform plays often appear to be terrible business decisions for years before they become obviously valuable.CUDA — Nvidia's software platform that made it possible to harness graphics card compute power for general-purpose usage — is the perfect example of this.When Nvidia was spending heavily on CUDA in the mid-2000s, the market saw it as an expensive distraction from its core graphics business.The investment made no sense. They were giving away free software to sell hardware, in an industry where hardware margins were already under pressure.Markets tend to price such technology investments through the lens of existing applications rather than potential ones. They can see the current build cost but fail to factor in the potential future value.
The Economics of Platform Capture
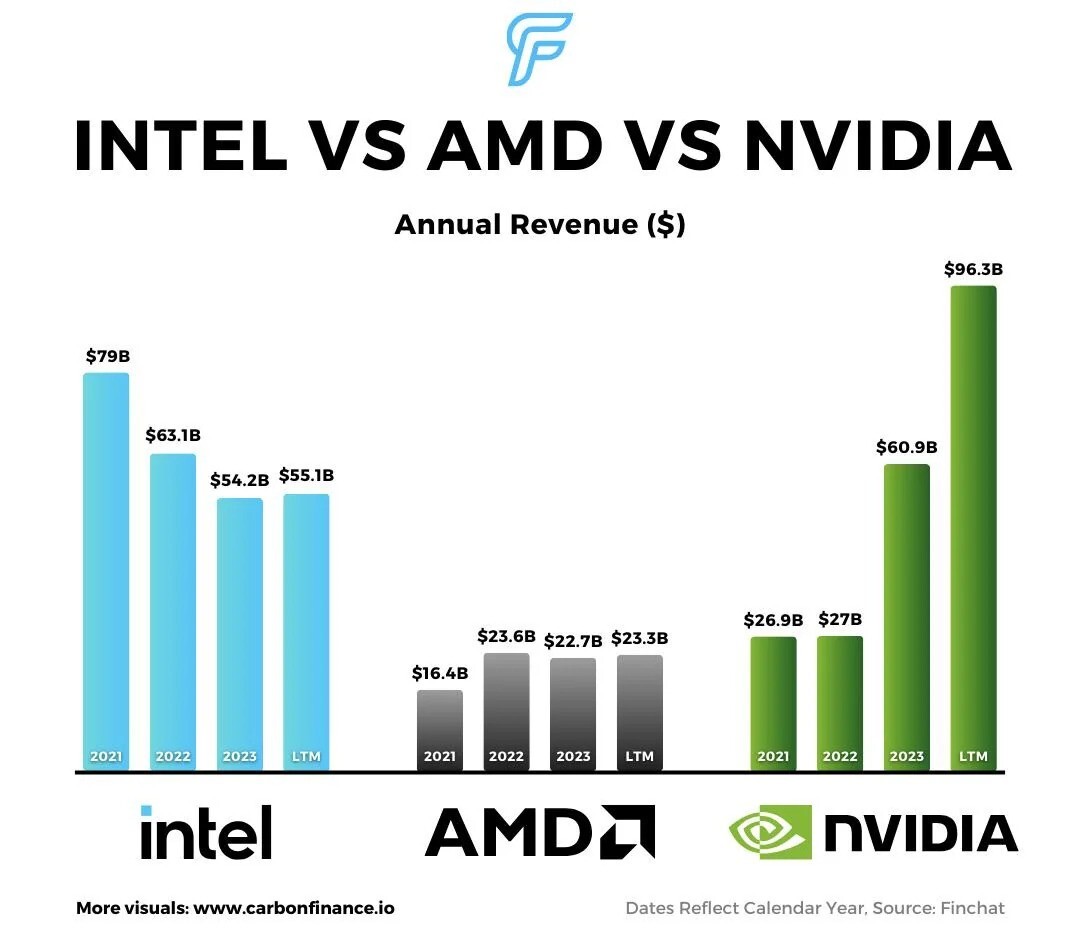
Technology markets have the somewhat unique capacity to shift from competing products to competing ecosystems.If this shift from product to ecosystem wars occurs, traditional competitive analysis can become almost useless.In a product market, a 10% advantage might translate to a 10% market share gain. In an ecosystem market, a 10% advantage can translate to a 90% market share, due to network effects and switching costs.This is why established companies with superior resources often lose to platform challengers. AMD and Intel both had as much (or more) money and engineering talent as Nvidia during its CUDA development years. But they were competing in the wrong game. They were optimizing for product performance while Nvidia was building ecosystem lock-in.
The Platform Investment Paradox
Platform investments create a paradox for public markets. The companies that make the biggest platform bets often see their stock prices suffer during the investment phase.Product investments have visible, measurable returns that markets can model. Platform investments have uncertain returns that depend on market timing and adoption patterns that are impossible to predict.This is why markets consistently undervalue platform companies during their growth phase. Traditional financial metrics capture the cost of platform investment but miss the value creation occurring in the ecosystem.By the time platform value becomes visible in financial results, the strategic opportunity has usually already passed. The companies that capture platform markets are typically those that invest before the value is measurable, not after it becomes obvious.
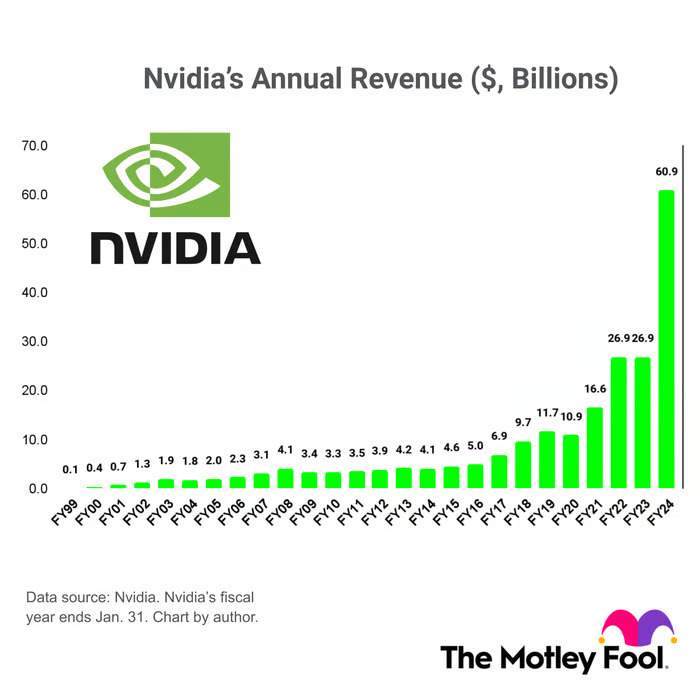
Nvidia’s 25-year Annual revenue growth - image by Motley Fool
Ecosystem Network Effect
Every developer who learns CUDA makes the Nvidia ecosystem more valuable. Every model trained on Nvidia infrastructure increases switching costs for the entire AI market.Gaining a competitive advantage in platform markets is more about ecosystem momentum than building superior products. The platform that attracts the most developers and creates the most applications becomes increasingly difficult to displace.Markets often misinterpret this momentum as a temporary competitive advantage rather than recognizing it as a structural shift in the market. They keep expecting "competition" to erode platform dominance, not realizing that successful platforms tend to make competition irrelevant.
What This Means for Market Analysis
The Nvidia pattern suggests that technology market analysis needs to focus more on ecosystem dynamics and less on product comparisons. The companies that will dominate the next wave of technology markets are likely building platforms today for applications that don't yet exist at scale.This requires looking beyond current revenue and margins to understand what infrastructure is being built for the future. The most important question isn't whether a company has the best current product, but whether they're creating the ecosystem that future applications will be built on.Of course, such companies are unlikely to achieve the heights of Nvidia, but the ones that find success will likely follow the same pattern — years of patient platform building followed by explosive ecosystem capture when the market inflection point arrives.Trade Nvidia and thousands of other Share CFDs on GO Markets — starting from just US$0.02 per share with no monthly data fee.
By
GO Markets
The information provided is of general nature only and does not take into account your personal objectives, financial situations or needs. Before acting on any information provided, you should consider whether the information is suitable for you and your personal circumstances and if necessary, seek appropriate professional advice. All opinions, conclusions, forecasts or recommendations are reasonably held at the time of compilation but are subject to change without notice. Past performance is not an indication of future performance. Go Markets Pty Ltd, ABN 85 081 864 039, AFSL 254963 is a CFD issuer, and trading carries significant risks and is not suitable for everyone. You do not own or have any interest in the rights to the underlying assets. You should consider the appropriateness by reviewing our TMD, FSG, PDS and other CFD legal documents to ensure you understand the risks before you invest in CFDs. These documents are available here. Any references to Australian or international shares, sectors, indices, ETFs, crypto-related stocks or other instruments are provided for market commentary and watchlist purposes only and do not constitute a recommendation, offer or solicitation to buy, sell or hold any financial product or adopt any investment strategy. International markets may involve additional risks, including currency fluctuations, regulatory differences, market structure differences, reduced liquidity and higher volatility. Company-specific, sector-specific and macroeconomic risks may also affect performance.
Commentary on geopolitical developments, economic data, central bank decisions, earnings, policy changes and other global or financial market events is based on information available at the time of publication and may change without notice. Such events can lead to sudden market moves, price gaps, reduced liquidity, wider spreads and increased volatility, particularly in leveraged products such as CFDs. Forward-looking statements, expectations and scenario analysis are inherently uncertain and should not be relied on as guarantees of future market behaviour or outcomes.
The “resilient consumer” line being recycled across earnings calls is doing a lot of work. Index-level data helps it along. Headline retail sales hold. Spending looks firm. Stop reading there and the story looks simple.
Few companies in modern market history have attracted the level of sustained anticipation surrounding a potential SpaceX public listing.
GO Markets | SpaceX IPO Trading Playbook - Part 1
The IPO Context
For years, traders and investors have watched private funding rounds push the company’s valuation into territory usually associated with major public companies. Each round has raised the same question: when, whether and how does SpaceX, or its Starlink satellite division, finally come to market? It is part of a wider watchlist of major IPO candidates in 2026.
Because major initial public offering (IPO) events do not always move only the company being listed. They can move the assets around them. The SpaceX story is also a useful lens for understanding the mechanics that matter around major listings: private valuation versus public price discovery, institutional allocation versus open market access, lockup schedules, float structure and the risk of a broken IPO when the offer price proves too demanding.
The mistake is to treat a high-profile IPO as a simple popularity contest, or worse, as a crowded trade where attention gets mistaken for execution quality.
Why mega-cap listings can move more than one market
A major public listing does more than create a new tradeable instrument. It changes the reference point for an entire sector. The impact can be supportive or disruptive. A successful listing may validate investor appetite for the sector. A demanding valuation can also drain attention and capital from listed peers as investors compare multiples, growth profiles and liquidity. Both outcomes can occur across different timeframes.
For CFD traders, the relevant question is not simply whether the company is admired. It is whether the listing changes volatility, liquidity, relative valuation or sentiment in instruments already available to trade.
The Valuation Overhang
Private rounds set reference prices, not public market support. In a mega-cap listing, the risk is not whether the company is admired. It is whether the offer price already capitalises the best version of the story. If the first tradeable price cannot absorb that expectation, the IPO can break quickly.
Allocation friction as a volatility catalyst
Institutional investors participate in book-building before the listing. They may receive an allocation at the IPO offer price, subject to demand, syndicate decisions and allocation rules. Public market and CFD participants usually enter after trading begins, at the open market price available on the platform or exchange. That access gap is not merely a disadvantage. It is a source of volatility.
If the offer is heavily oversubscribed and the float is limited, the opening price may gap above the offer price. If demand is weaker than expected, or if the valuation was set aggressively, the opening trade may struggle to hold the IPO price.
Key mechanics that shape IPO trading
Book-building
+
The process where investment banks gather demand from institutional investors to help set the offer price.
Why it matters to traders
The offer price reflects institutional demand before public trading begins. It may differ from the price available once the market opens.
Syndicate allocation
+
The distribution of IPO shares among selected institutional investors and eligible participants.
Why it matters to traders
Allocation decisions influence who owns stock at the offer price and how much supply may later reach the open market.
Flotation percentage
+
The proportion of the company sold to public investors at listing.
Why it matters to traders
A smaller float can increase scarcity and volatility. A larger float may improve liquidity but may require deeper demand.
Free float
+
The shares available for public trading after restricted holdings are excluded.
Why it matters to traders
A low free float can amplify price moves because less stock is available to absorb demand or selling pressure.
Grey market pricing
+
Indicative pre-listing pricing in unofficial or conditional markets, where available.
Why it matters to traders
Grey market levels can reveal sentiment before listing, but they are not a guaranteed guide to the opening price.
Indicative price range
+
The expected offer price range published before final pricing.
Why it matters to traders
Pricing above or below the range can signal demand strength or weakness, but the first public trade remains the key market test.
Stabilisation
+
Actions that may be used by underwriters to support orderly trading after listing, subject to rules and disclosure.
Why it matters to traders
Stabilisation can affect early price behaviour. Traders should read the offer documents rather than assume the tape is purely organic.
Lockup expiry
+
The date when insiders or early investors may be able to sell restricted shares.
Why it matters to traders
It is a structural supply event. Even a strong listing can face pressure as lockup expiry approaches.
Broken IPO
+
A listing that trades below its IPO offer price soon after launch.
Why it matters to traders
It can signal that the offer valuation was too demanding, market conditions changed or demand was not deep enough.
Valuation overhang
+
A situation where a high listing valuation constrains later upside because expectations are already elevated.
Why it matters to traders
Strong companies can still deliver weak trading outcomes if the entry valuation leaves limited room for disappointment.
SpaceX and Starlink as a listing lens
SpaceX is unusual because the broader business spans rocket manufacturing, launch services, satellite internet through Starlink and government or defence-adjacent activity. Those segments can attract different valuation methods, investor bases and risk assumptions.
Starlink has often been discussed as the more likely standalone listing candidate because subscription revenue can be easier for public markets to model than a broader aerospace and launch business. That does not make the valuation simple. Satellite infrastructure is capital intensive, competitive and exposed to regulatory, geopolitical and technology-cycle risks.
For traders, the listing structure matters. A Starlink-only IPO may read more like a communications infrastructure and high-growth technology event. A broader SpaceX listing may be interpreted through aerospace, defence, government contract and frontier technology lenses. The related-market reaction could differ materially depending on which entity, if any, comes to market.
Space economy ecosystem map
SpaceX’s relationship with publicly listed sectors, showing the instruments traders often monitor in response to SpaceX news across launch services, satellite communications, defence contracting and earth observation.
Ecosystem Driver
SpaceX (Private Entity)
Market Access StatusNo Public Ticker
Launch Competitors
RKLB Rocket Lab USA
Electron · Neutron (2026 platform deployment system framework)
Direct Competitor
BA Boeing
ULA framework partnership infrastructure · SLS platform development
ULA Exposure
LMT Lockheed Martin
ULA infrastructure matrix deployment · Orion development systems
ULA Exposure
Satellite Communications
ASTS AST SpaceMobile
Mobile satellite broadband connectivity frameworks
Starlink Rival
IRDM Iridium Comms
LEO voice and specialized programmatic data architectures
Starlink Rival
SPIR Spire Global
Global weather monitoring systems and critical maritime logistics telemetry
Launch Customer
Defence Contractors
BA Boeing
NASA structural flight operations and primary institutional DoD contracts
Contract Rival
LMT Lockheed Martin
Orion modular space platform execution and core weapon systems matrices
Contract Rival
NOC Northrop Grumman
Cygnus mission logistics transport frameworks and aerospace production lines
Broadly diversified index framework track of global aerospace equity allocation
Sector Index
Reading the diagram: SpaceX sits at the centre of the ecosystem. The strongest reactions to SpaceX news typically come from RKLB (direct launch competitor) and ASTS/IRDM (Starlink competes directly in their broadband market). Defence contractors BA, LMT, and NOC are affected mainly by government contract outcomes.
Data sources & Disclaimers: Sector classifications based on company 10-K filings, SEC filings, and public analyst reports.
• Constellation Metric: ~6,000 active operational units deployed globally with an estimated baseline user matrix of 4M+ scaling subscribers (subscriber estimate via third-party industry analysis, Bank of America 2024; satellite count from FCC orbital debris filings and SpaceX press releases).• Strategic Layout Exposure: BA and LMT hold launch market cross-exposure via their 50% strategic joint ownership structure of United Launch Alliance (ULA) alongside distinct standalone configurations.
UFO ETF holdings from Procure Space ETF prospectus. This diagram layout structure is for educational illustration only and does not represent all competitive alignments or complete market execution dynamics.
Preparation, scenarios and risk management
The trader’s watchlist
A major IPO event can affect more than the listing itself. Traders may monitor the surrounding market structure through a focused set of instruments and signals.
Market signal
Why it matters for a SpaceX or Starlink listing
Aerospace and satellite communication stocks
Tracks sector validation, competitive repricing and capital rotation across listed space-adjacent names.
Nasdaq 100 and US technology sentiment
Frames appetite for high-growth, innovation-led listings. Weak technology sentiment can weigh on demand even when the company narrative is strong.
S&P 500 futures and broader US equity tone
Shows whether the listing is arriving into a supportive risk environment or a broader equity drawdown.
US dollar index
Helps frame global risk appetite and US dollar-denominated market conditions. A stronger US dollar can coincide with more defensive positioning.
US 10-year Treasury yield
Tracks valuation sensitivity. Rising yields can pressure capital-intensive, high-growth listings by discounting future cash flows more heavily.
Indicates whether the market is likely to support new issuance or demand a larger valuation discount.
Formal filings, roadshow updates and pricing range
Provides the direct event path from speculation to tradeable catalyst. Filing detail, indicative range and final pricing can shape first-day expectations.
Comparable IPO performance
Shows how recent high-profile listings have traded after pricing. Useful as context, not as a forecast.
Historical volatility in space economy stocks around SpaceX events
Average absolute daily percentage moves for RKLB, ASTS and IRDM across three conditions: normal trading days, SpaceX Starship launch days and the following trading day. All three stocks showed materially elevated volatility on or around SpaceX milestones.
RKLB — Rocket Lab USA
1.76×
Volatility multiplier on SpaceX launch days vs. normal sessions (2023–2024)
Baseline ~3.8% → event day ~6.7%
ASTS — AST SpaceMobile
1.66×
Highest absolute daily volatility of the three across all conditions
Baseline ~5.9% → event day ~9.8%
IRDM — Iridium Comms
2.00×
Most stable of the three; still doubles in volatility on SpaceX event days
Baseline ~1.4% → event day ~2.8%
Baseline (avg. non-event sessions)
SpaceX Starship launch day
Day after SpaceX launch event
Event
Date
Outcome
Result
RKLB +1d
ASTS +1d
IRDM +1d
IFT-1
Apr 20, 2023
Explosion at launch pad — vehicle lost 4 min after liftoff
Failure
+6.2%
+8.4%
+2.1%
IFT-2
Nov 18, 2023
Both stages lost; partial hot-stage separation success
Failure
+3.1%
+5.2%
+0.8%
IFT-3
Mar 14, 2024
First Starship to reach space; both stages lost on re-entry
Mixed
−1.5%
−2.3%
+0.4%
IFT-4
Jun 6, 2024
First successful booster splashdown and ship controlled re-entry
Success
−3.8%
−6.1%
−1.9%
IFT-5
Oct 13, 2024
Booster caught by "chopsticks" launch tower arms — historic milestone
Success
−4.3%
−7.8%
−2.4%
IFT-6
Nov 19, 2024
Ship successful re-entry; booster failed catch and splashed down in Gulf
Mixed
+2.1%
+1.4%
+0.6%
What the data shows: All three stocks experienced materially higher volatility on SpaceX Starship launch days compared with normal trading sessions.
ASTS carried the highest absolute daily moves, both in baseline conditions and around events. That may reflect its early-stage, high-growth profile and direct Starlink competition. IRDM was the most stable of the three, although it still showed a wider daily range around SpaceX event days. For CFD traders, wider ranges can increase the effective cost of entry and exit around major events, particularly where spreads also widen.
Data sources: Volatility baselines are derived from 30-day rolling average absolute daily percentage changes for each stock during 2023 and 2024, compiled from StockAnalysis, TipRanks and Investing.com historical price data. Event day and post-event session reactions are sourced from contemporaneous financial media coverage and public historical price data. SpaceX Starship test flight dates and outcomes are confirmed via Wikipedia and SpaceX official communications. Figures are approximate.
The launch-event scenario map
These scenarios support conditional thinking before price begins moving quickly.
If this condition occurs
Traders may monitor
Risk to consider
An S-1 filing or equivalent document is submitted
Whether related aerospace and technology stocks respond immediately or wait for financial details.
First reactions can be sharp and short-lived. A filing can be faded if valuation or risk disclosures disappoint.
The IPO prices above the indicative range
Whether opening-day price action confirms or rejects the aggressive valuation.
High-end pricing can increase the risk of a broken IPO if open-market demand is not deep enough.
The floatation percentage is low
Whether scarcity drives a sharp opening move or creates unstable liquidity.
Low free float can amplify upside and downside moves. Spread conditions may deteriorate.
The broader equity market is risk-off near listing
Whether institutional demand is strong enough to support the offer price.
Risk-off conditions increase the probability of a weak open, delayed listing or rapid post-open reversal.
The lockup expiry approaches after listing
Whether insider selling pressure appears and whether key support levels hold.
Lockup expiry is a structural source of potential supply. It should not be treated as a surprise event.
SpaceX or Starlink delays or withdraws plans
Whether pre-event optimism in related names reverses.
Sentiment-driven gains can unwind quickly if the catalyst disappears.
Execution risk checklist
Use this checklist before making any decision around an IPO-related market event. It is not a trading signal. It is a risk review standard.
Execution Infrastructure: Map these scenarios using GO Markets' integrated TradingView charting, track overlap via the Economic Calendar, and test spread assumptions in a demo environment before committing live capital.
Questions investors are asking
How could a Starlink IPO affect valuation multiples for legacy aerospace and defence names?
+
A standalone Starlink listing could give the market a clearer public benchmark for satellite communications and space-linked infrastructure assets. That may influence how investors compare growth rates, revenue visibility, capital intensity and margins across listed peers. The effect would not necessarily be positive for all competitors. A high valuation could lift sector interest, while a weak listing could pressure multiples across related names.
Why does market capitalisation weighting matter after a mega-cap listing?
+
If a large new listing becomes eligible for major indices, index methodology can matter. Inclusion rules, free-float adjustments and weighting limits may influence passive demand over time. The timing is not immediate. It depends on index provider rules, eligibility criteria and liquidity. Index inclusion is better treated as a separate lifecycle event, not a guaranteed first-day catalyst.
What is the difference between the IPO offer price and the first tradeable price?
+
The IPO offer price is set before public trading through the book-building process. The first tradeable price is the price available once the stock begins trading publicly. Public market and CFD participants may not be able to access the offer price, so the first tradeable level can already reflect institutional allocation, scarcity, sentiment and opening auction dynamics.
Why can a heavily anticipated IPO break below the offer price?
+
High demand before listing does not remove valuation risk. A heavily anticipated IPO can break if the offer price is too aggressive, the broader market turns risk-off, the free float is misjudged or early holders sell into the opening demand. A broken IPO does not automatically mean the business is weak. It means the market rejected the price, the timing or both.
How would a Starlink listing differ from a broader SpaceX listing?
+
A Starlink-only listing may be assessed through recurring revenue, subscriber growth, infrastructure costs and competition in satellite broadband. A broader SpaceX listing may require a wider framework that includes launch services, government contracts, manufacturing capability, defence-adjacent exposure and long-horizon projects. The relevant peer group and valuation multiples could differ materially.
What to watch from here
The SpaceX IPO narrative is one of the more consequential market stories in the current environment. Whether or not a listing occurs in the near term, the preparation work is similar: understand the listing structure, monitor related instruments, map the scenario framework and define risk controls before the event arrives.
When ready to move from theory to practice, explore GO Markets IPO education resources, platform tools and demo environment to test the process in real market conditions.
For US retailers and consumer brands, the first hit is usually margin. Import costs rise before pricing power does. Companies can try to pass those costs on, but customers may resist higher prices, especially if household budgets are already stretched. Existing inventory can also soften the first blow, which means the initial earnings result may look manageable while the next one carries the real pressure.
Tariffs, earnings and the Asia versus US split | GO Markets
Same tariff. Different earnings hit.
That is the key split for traders watching this earnings season. The US side is mainly about margin timing. The Asia side is about demand sensitivity. Not every export sector carries the same level of US demand risk.
TL;DR
US companies may face margin pressure as tariffed inventory moves through earnings.
Asian exporters may face volume pressure if US buyers reduce orders.
The timing is different: US retailers may feel the impact later, while Asian exporters may see it earlier through weaker order books.
Textiles, apparel and basic consumer goods are likely more sensitive to US demand.
Semiconductors and AI hardware may be less directly exposed to US consumers, but still carry policy, capex and valuation risk.
The big picture
Tariffs are paid at the US border by importers. From there, the cost can move through the system in several ways: higher prices, weaker margins, lower supplier prices, lower demand or a mix of all four.
Research cited by the Kiel Institute and New York Fed suggests US buyers and businesses may be absorbing a significant share of the tariff burden. That matters because it changes where the earnings pressure shows up first.
For a US retailer, the problem is straightforward but uncomfortable. If the company raises prices, demand may weaken. If it absorbs the tariff cost, margins may compress. If it still has older inventory, the hit may not show up immediately.
For an Asian exporter, the pressure can arrive through a different channel. If US buyers become cautious, they may order less. The exporter may keep prices relatively stable, but factory utilisation falls, fixed costs are spread across fewer units and earnings pressure builds.
That is why this is not just a tariff story. It is an earnings timing story.
US companies: the margin problem
The US side of the tariff story is about cost absorption.
Retailers, apparel brands, consumer electronics sellers and appliance companies often rely on imported goods, components or packaging. When tariff costs rise, they may try to protect margins through price increases, supplier negotiations, sourcing changes or inventory management.
The challenge is that none of these are clean solutions.
Price increases can test consumer demand. Supplier negotiations may take time. Sourcing changes can be expensive or slow. Inventory timing can make the first result look better than the underlying cost trend.
This is why earnings calls matter. Management commentary around pricing actions, tariff mitigation, sourcing, vendor negotiations and inventory timing may reveal more than headline sales growth.
What to watch on the US side
These signals may provide useful context in upcoming earnings reports:
If margins hold while sales remain stable, companies may be managing the pressure. If sales rise but margins fall, tariff costs may not be passing through cleanly. If guidance becomes more cautious, the market may start pricing a delayed earnings impact.
Asian exporters: the volume problem
The Asia side is not always about exporters cutting prices.
In many categories, Asian suppliers operate in competitive global markets with limited pricing power. If US buyers reduce orders, exporters may feel the impact through lower volumes rather than lower unit prices.
That distinction matters.
A company can report stable prices and still face earnings pressure if factories are running below normal utilisation. Lower volumes can reduce operating leverage, delay capital expenditure and weaken guidance.
The highest-risk sectors are usually those most closely tied to US retail demand, seasonal buying cycles and low-margin production.
Which Asian sectors are most exposed?
1. Textiles and apparel +
Highest Sensitivity
Textiles and apparel are among the clearest examples of US demand exposure.
These exporters are often tied directly to US retail orders, private-label contracts and seasonal buying cycles. If US retailers turn cautious, orders can be delayed, reduced or cancelled relatively quickly.
Risk is higher because margins are often thin, production is labour-intensive and buyers may have more power in negotiations.
Relevant export markets: Vietnam, Bangladesh, India, Indonesia and parts of China.
2. Basic consumer goods +
High Sensitivity
This includes toys, household goods, furniture, simple appliances and other discretionary or semi-discretionary exports.
These categories are exposed when US retailers reduce inventory or when consumers pull back from non-essential spending. Tariffs can add pressure if buyers try to push costs back onto suppliers.
Relevant export markets: China, Vietnam, Thailand, Malaysia and Indonesia.
3. Electronics assembly +
Medium to High Sensitivity
Electronics assembly is more mixed.
Lower-end consumer electronics can be sensitive to US household demand. Higher-value components or enterprise-linked electronics may be more resilient, depending on end-market exposure.
This sector can also be harder to read because supply chains are complex. A company may look like a technology exporter, but its actual earnings sensitivity may still depend on US consumer replacement cycles.
Relevant export markets: China, Vietnam, Malaysia, Thailand, Taiwan and the Philippines.
4. Machinery and industrial goods +
Medium Sensitivity
Machinery is less directly tied to US consumer demand than apparel or household goods. The risk is more about business investment.
If US companies delay capital expenditure because tariff uncertainty rises, machinery orders may weaken. However, order books can provide some buffer, and specialised products may have more pricing power.
Relevant export markets: Japan, South Korea, China, Taiwan and Singapore.
5. Semiconductors +
Lower Direct Sensitivity
Semiconductors are less directly exposed to US retail demand than textiles or consumer goods. Demand is often tied to broader technology cycles, autos, industrials, cloud infrastructure and AI investment.
That does not make the sector risk-free. Tariffs, export controls, geopolitics and a weaker global capex cycle can still affect earnings expectations.
Relevant export markets: Taiwan, South Korea, Malaysia, Singapore and parts of China.
6. AI hardware and data-centre supply chains +
Lowest Direct Sensitivity
AI hardware is more tied to cloud capital expenditure and data-centre buildouts than day-to-day consumer spending.
The risk is different. It is less about US shoppers buying fewer goods and more about whether AI capex expectations remain realistic, whether policy restrictions expand and whether valuations already price in strong growth.
Relevant export markets: Taiwan, South Korea, Malaysia and advanced electronics supply-chain hubs.
A simple sector risk map
Sensitivity Analysis
Indicative Asian exporter sensitivity to US consumer demand
Note: This is a general framework only. Sensitivity may vary by company, customer mix, contract structure and end market exposure.
Why timing matters
The US and Asia timelines may not line up.
A US retailer may still be selling older inventory, so the tariff impact can be delayed. Margins may hold in one quarter, then weaken as new tariffed inventory becomes a larger share of the sales mix.
An Asian exporter may see the pressure earlier if US buyers reduce orders before the cost hit appears in US consumer prices.
That creates a split earnings map:
US side: delayed margin pressure.
Asia side: earlier volume pressure.
Policy side: tariff exemptions, pauses or escalations can change the setup quickly.
The mistake is assuming a clean and immediate tariff impact. A strong US retailer result does not automatically mean tariff pressure is gone. It may only mean older inventory is still flowing through. A stable Asian exporter margin does not automatically mean demand is healthy. Volumes may be weakening beneath the surface.
The trap in the earnings season
What to watch next
On the US side, gross margins, inventory commentary, same-store sales and second-half guidance may provide useful context.
On the Asia side, export volumes, factory utilisation, order backlogs, working capital and capital expenditure guidance may be more relevant.
Across both regions, tariff policy remains the swing factor. Exemptions, pauses or new restrictions could quickly change market expectations.
Sector charts may provide additional context on whether market pricing is aligning with the earnings narrative, but they should be read alongside company commentary and macro data from the economic calendar.
FAQ
Frequently asked questions
How do tariffs affect US companies and Asian exporters differently? +
Tariffs may affect US companies through margin pressure and Asian exporters through volume pressure. US companies may face higher import costs, while Asian exporters may face fewer orders from US buyers.
Which Asian export sectors are most exposed to US demand? +
Textiles, apparel and basic consumer goods are generally more exposed to US demand because they are closely tied to retail orders and consumer spending. Electronics assembly and machinery are moderately exposed, while semiconductors and AI hardware may be less directly exposed.
Why can tariff impacts show up later in retailer earnings? +
Retailers may still be selling older inventory purchased before tariffs applied. The impact may become more visible later as new tariffed inventory moves through sales and margins.
What should investors watch in tariff-related earnings reports? +
General signals include gross margins, inventory commentary, same-store sales, export volumes, factory utilisation, order backlogs and management commentary on pricing or sourcing.
Are semiconductors and AI hardware exposed to tariffs? +
They may be less directly exposed to US consumer demand, but they can still be affected by policy restrictions, export controls, global capex cycles and valuation expectations.
Bottom Line
The tariff story is no longer only about who pays. It is about where the earnings pressure shows up first.