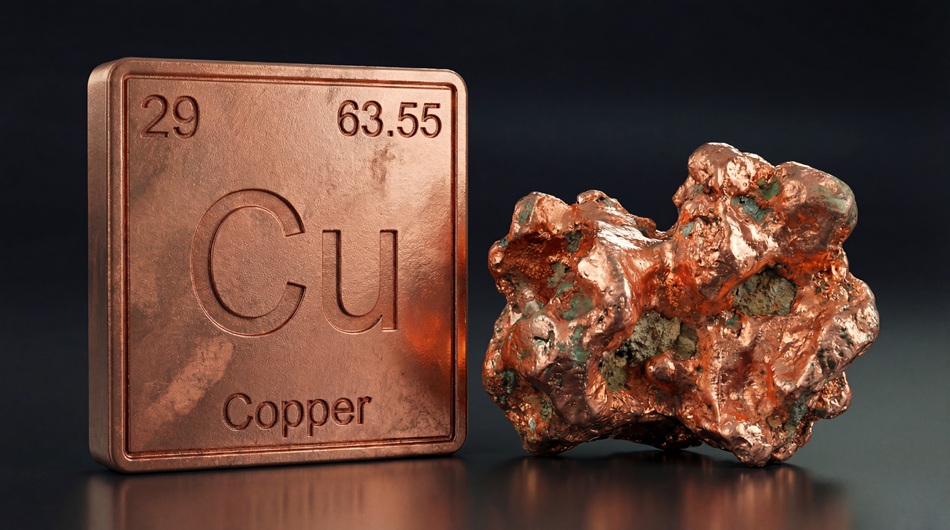

Part three of GO Markets’ commodities series, explaining why copper is closely watched as a barometer of industrial activity and global economic demand.
Copper is everywhere: in your walls, your vehicle, your smartphone, and every building under construction. That physical ubiquity is exactly why traders pay attention to it.
When demand for copper rises, factories are running, buildings are going up, and infrastructure is expanding. When demand falls, the industrial engine is slowing. No financial asset can fake that physical signal. Copper moves on real physical demand, earning it the informal title of Dr Copper: the commodity with a PhD in economics.
What copper trading actually is
Copper is an industrial base metal traded globally as a primary raw material. On trading platforms, retail market participants generally access exposure through contracts for difference (CFDs) labelled under symbols such as HG or Copper, benchmark futures contracts, or copper-mining equities.
Unlike financial derivatives or paper assets, physical copper is bound to the real economy. Building on the macro foundations introduced in our gold trading guide and crude oil guide, copper represents a direct gauge of physical production rather than monetary sentiment or energy geopolitics.
Used extensively across construction, power generation, electronics, and manufacturing as an irreplaceable electrical conductor.
RAW MATERIAL BENCHMARKTraded via spot/CFD contracts (HG/Copper), COMEX/LME futures, or shares in major copper-mining corporations.
TRADABLE INSTRUMENTSWhy it is called Dr Copper
Copper earned its academic moniker because it touches almost every major sector of economic activity. It provides essential wiring and plumbing in residential and commercial construction, powers machinery and circuitry in manufacturing, and forms the core of global electricity grids and transport networks.
Because demand for copper tracks physical economic output rather than speculative expectations, its price tends to rise ahead of or alongside economic expansion and drop ahead of or alongside contractions. This forward-looking tendency makes it a leading economic indicator.
Why China is copper's dominant demand driver
China accounts for approximately half of global copper consumption. Its extensive construction sector, massive manufacturing base, ongoing power grid expansion, and growing electric vehicle industry make Chinese demand the dominant price driver for the metal.
Industrial appliances, HVAC systems, transformers, and electronic motors. Highly responsive to factory output and business capital expenditure cycles across Asia and North America.
As established in our ASX 200 guide and AUD/USD guide, Australian markets share a strong structural dependency on Chinese industrial appetite. Chinese macroeconomic data, particularly property sector health, construction starts, manufacturing Purchasing Managers' Index (PMI) readings, and infrastructure spending announcements, frequently trigger immediate repricing across global copper markets.
How copper differs from gold as a market signal
While both are globally traded commodities priced in US dollars, copper and gold deliver opposite market signals. Gold is primarily a monetary and financial asset driven by real yields, central bank reserves, and safe-haven demand during periods of fear.
Copper, by contrast, is a physical industrial asset driven purely by economic expansion. When market anxiety rises, gold frequently rallies as investors seek protection, while copper often falls due to anticipated reductions in manufacturing and construction activity.
Treating copper and gold as equivalent commodity trades driven by the same forces is a massive mistake.
Gold rises on fear, inflation expectations, and falling real yields. Copper rises on real industrial demand and economic expansion. They have almost no shared drivers.
A gold rally during a geopolitical crisis tells you traders are fearful and seeking safety. A copper rally during the same period might actually reverse if the geopolitical event threatens global growth or disrupts Chinese activity.
Reading a gold chart and a copper chart side by side without understanding that they measure completely different things is one of the most common commodity analysis mistakes beginners make. Gold is a fear signal. Copper is a growth signal. They are different instruments answering different questions.
Why copper matters to Australian traders specifically
Copper price action carries direct implications for Australian market participants. Australia holds significant copper reserves, and ASX-listed mining stocks[cite: 3] experience direct earnings sensitivity to international copper prices.
When global copper demand expands, Australian mining equities generally receive fundamental support, which can contribute positively to the broader ASX 200 Index. Furthermore, because AUD/USD operates as a commodity currency closely linked to Chinese demand, strong copper price action driven by Chinese industrial activity often coincides with strength in the Australian dollar.
Beyond traditional construction and infrastructure, the global energy transition has introduced a long-term structural demand driver for copper. Electric vehicles (EVs), renewable energy generation, and battery storage systems require significantly more copper per unit than legacy fossil-fuel technologies.
While traditional construction cycles remain the primary near-term price driver, this structural electrification trend provides an underlying demand baseline for the metal.
What moves copper
The copper market responds to physical supply constraints and sweeping industrial demand trends.
China consumes roughly half of all refined copper.
Chinese manufacturing PMI rises, property sector activity improves, or infrastructure spending increases.
Chinese PMI contracts, property stress rises, or construction data slows.
Industrial demand across North America, Europe, and emerging markets provides a broader foundation outside China.
Global manufacturing PMI data expands across major industrial economies.
Global manufacturing contracts or broad recession risks rise.
Mine development requires years of capital investment, making short-term supply highly inelastic.
Major mine disruptions, labour strikes, or logistical bottlenecks occur in Chile or Peru.
New mine capacity opens or major supply disruptions are resolved.
Copper is priced globally in greenbacks. Explore currency mechanics in our US dollar guide[cite: 3].
The US dollar weakens broadly, lowering purchase costs for international buyers.
The US dollar strengthens broadly across international currency markets.
Chinese infrastructure and property stimulus announcements drive immediate physical demand expectations for refined copper. Copper prices rally, boosting revenues for ASX-listed mining giants and supporting commodity-currency inflows into AUD/USD.
How copper connects to the markets you trade
Because it acts as a global growth barometer, copper moves closely alongside several major assets:
Australian copper producers and diversified miners experience immediate earnings adjustments when copper prices shift. Because the mining sector carries heavy index weight, strong copper momentum supports the broader ASX 200 Index.
Because Australia is a major exporter of raw metals and China is Australia's primary trade partner, copper rallies driven by Chinese demand frequently coincide with strength in the AUD/USD currency pair.
Copper and gold offer opposite market signals. Gold is a monetary safe haven that rallies on fear and falling real yields, whereas copper is a physical industrial metal that rallies on economic expansion and manufacturing growth.
Simultaneous price increases across both copper and crude oil provide strong cross-market confirmation that physical industrial output, freight transport, and global manufacturing are expanding.
Don't just watch the copper price as a number. Watch what it is signalling about Chinese economic activity and global industrial demand.
A copper rally is most meaningful when it is confirmed by strong Chinese PMI data, rising steel production, or infrastructure investment announcements: signs that real physical demand is increasing. A copper move that happens without any of those confirmations, driven purely by speculation or a single data point, is less reliable as a global growth signal.
Copper earns its Dr Copper title when the price and the real economic data are telling the same story. When they diverge, treat the signal with more caution.
Copper is the market's ultimate growth signal. When it rises on genuine demand, real economic activity is expanding. When it falls, something in the global industrial engine is slowing.
For Australian traders, that signal is almost always about China.
Test your knowledge
Copper is the market's ultimate physical growth signal. When it rises on genuine demand, real economic activity is expanding.

Disclaimer: Articles are from GO Markets analysts and contributors and are based on their independent analysis or personal experiences. Views, opinions or trading styles expressed are their own, and should not be taken as either representative of or shared by GO Markets. Advice, if any, is of a ‘general’ nature and not based on your personal objectives, financial situation or needs. Consider how appropriate the advice, if any, is to your objectives, financial situation and needs, before acting on the advice.