Academia
Markets

IPOs y lo que necesitas saber

Este es el punto en el que lo 'privado' se vuelve 'público'. Le da al mercado su primera mirada real al interior de empresas como OpenAI, SpaceX y una nueva ola de aspirantes a la ASX.

¿Qué es una IPO?

Una oferta pública inicial (IPO) ocurre cuando una empresa privada ofrece sus acciones al público por primera vez. Antes de una IPO, las acciones suelen estar en manos de fundadores, primeros empleados e inversionistas privados, pero salir a bolsa abre esas acciones a un mercado más amplio.

Para los traders, las IPO pueden ser la primera oportunidad de obtener exposición directa a las acciones de una empresa. Pueden crear un entorno único de volatilidad elevada y mayor interés, pero también conllevan más riesgo porque el historial de precios es limitado y el sentimiento puede cambiar rápidamente.

US$171.8 billion

Recaudación global de IPOs en 2025, un 39% más interanual

US$3 trillion plus

Valoración estimada combinada de los principales candidatos a IPO en 2026

1,293

Cotizaciones globales en 2025, el repunte más fuerte desde el auge pospandemia

Próximas IPOs en bolsas globales

EmpresaValoración estimadaBolsaEstado
Anthropic
Artificial intelligence
~US$350 billionNasdaqRumoured
Databricks
AI and data
~US$134 billionNasdaqExpected
Firmus Technologies
AI infrastructure
~A$6 billionASXExpected
Greencross
Pet care & veterinary
~A$4 billion plusASXRumoured
OpenAI
Artificial intelligence
~US$850 billionNasdaqExpected
Rokt
E-commerce adtech
~US$7.9 billionNasdaq and ASX CDIExpected
SpaceX
Aerospace and AI
~US$1.5 trillionNasdaqExpected
Stripe
Fintech
~US$140 billionNYSE/NasdaqRumoured
Fuente: Anuncios de empresas disponibles públicamente, materiales de bolsas, reportes de medios confiables y comentarios de mercado, al 21 de abril de 2026. Las valoraciones estimadas, bolsas y estados de cotización son solo indicativos y pueden cambiar sin previo aviso.

Candidatas a IPO en EE. UU.

SpaceX, OpenAI, Anthropic y más

Leer más

Candidatas a IPO en la ASX

Firmus Technologies, Greencross y más

Leer más

Cómo funciona una salida a bolsa

De la sala de juntas al piso de la bolsa

Para el día de cotización, los inversionistas institucionales normalmente ya han evaluado la empresa. Entender el proceso de seis etapas ayuda a los traders a ver qué podría estar ya reflejado en el precio antes de que la acción abra al mercado más amplio.

Preparación

La empresa selecciona un suscriptor para evaluar sus finanzas, estructura corporativa y posicionamiento de mercado.

Registro

Los suscriptores realizan la debida diligencia y presentan documentos de divulgación ante el regulador correspondiente.

Roadshow

Los ejecutivos presentan la empresa a inversionistas institucionales y analistas. Aquí se construye la demanda y se fijan las expectativas de precio, antes de que los traders minoristas vean la acción.

Precio

Con base en los comentarios del roadshow, los suscriptores fijan el precio final de la acción y deciden cuántas acciones se emitirán.

Día de cotización

Las acciones comienzan a negociarse en la bolsa elegida. Para la mayoría de los traders, esta es la primera oportunidad de operar la acción.

Después de la IPO

Ya como empresa pública, la compañía debe publicar resultados financieros regularmente y cumplir con los estándares de gobierno corporativo de su bolsa.

Operar IPOs con CFDs

Por qué los CFDs se adaptan a la volatilidad de las IPO

El día de cotización de una IPO suele estar marcado por grandes cambios de sentimiento y un historial de precios limitado. Esa combinación puede hacer que la exposición tradicional de comprar y mantener sea más difícil de gestionar. Los CFDs permiten a los traders tomar una posición en cualquier dirección del movimiento, ajustar el tamaño con precisión y actuar rápido a medida que se desarrolla la historia.

Ir long o short

Opera el impulso inicial o la corrección posterior al entusiasmo. Los CFDs te permiten tomar una posición en cualquier dirección desde el día de cotización en adelante.

Horizontes de tiempo más cortos

La volatilidad de las IPO tiende a concentrarse en los primeros días y semanas. Los CFDs son adecuados para estas ventanas más cortas e impulsadas por eventos.

Herramientas de riesgo integradas

Las órdenes stop loss y limit pueden ayudar a definir tu riesgo antes de entrar, algo importante cuando el descubrimiento de precios aún está en marcha.

Cobertura de mercados de EE. UU. y Australia

Accede a CFDs sobre acciones en los mercados de EE. UU. y Australia, incluidos nombres como Rokt y Firmus Technologies, desde una sola cuenta.

¿Listo para operar el momento de la IPO?

Accede a CFDs sobre acciones en los mercados de EE. UU. y Australia, incluidos nombres como Rokt y Firmus Technologies, desde una sola cuenta.

¿Listo para operar el momento de la IPO?

Accede a CFDs sobre acciones en los mercados de EE. UU. y Australia, incluidos nombres como Rokt y Firmus Technologies, desde una sola cuenta.

Comenzar

Noticias y análisis

Por qué Tesla NexTera y Exxon importan esta temporada de ganancias, qué ver en las ganancias de Tesla 2026, cómo la demanda de energía de IA afecta a NextERA Energy, qué podrían indicar las ganancias de Exxon Mobil para los mercados petroleros, perspectiva de crecimiento de Tesla Megapack 2026, SiguienteExplicación de la demanda de energía del centro de datos, perspectiva de riesgo de suministro de petróleo de Exxon Mobil, acciones de energía a tener en cuenta en abril de 2026
AI
Commodity
Tesla, NextEra y Exxon: Demanda de petróleo vs IA esta temporada de ganancias en Estados Unidos

La temporada de ganancias de abril en Estados Unidos está aterrizando en un mercado que quiere algo más que una buena historia. Como destacó GO Markets en su reciente lista de seguimiento de ganancias de defensa, este periodo sobre el que se informa llega después de un cambio más amplio en lo que a los mercados les importa. Ya no se trata solo de crecer a cualquier costo. Los comerciantes quieren saber qué dicen los números debajo de la superficie.

Por qué son importantes estos 3 nombres

En esta parte del mercado, eso pone en foco a Tesla, Nextera Energy y Exxon Mobil. Cada uno ofrece una lectura diferente sobre un tema clave 2026: autonomía, demanda de electricidad y riesgo de suministro de petróleo.

  1. Tesla: Se está juzgando sobre si la autonomía y la energía pueden soportar la siguiente etapa de crecimiento
  2. Siguiente A: Ofrece una ventana a la creciente demanda de energía y la infraestructura necesaria para satisfacerla
  3. Exxon Movil: Se encuentra en el centro de la historia de la seguridad del petróleo y la energía, ya que los riesgos de suministro se mantienen en el foco

Tomados en conjunto, estos tres nombres ayudan a explicar dónde puede estar cambiando la atención. La pregunta ya no es solo quién tiene la narrativa más fuerte, más bien, quién puede mostrar demanda real, márgenes más firmes y ejecución que se sostenga en un telón de fondo más complicado.

En 2026, la demanda de energía de IA está empujando a los servicios públicos, el almacenamiento y la capacidad de la red a un enfoque más nítido, mientras que al mismo tiempo, el riesgo del suministro de petróleo ha devuelto la seguridad energética a la conversación del mercado.

IMPORTANT: REPORTING SCHEDULES CAN CHANGE WITHOUT NOTICE. REPORTING DATES AND RELEASE TIMES ARE FROM COMPANY INVESTOR RELATIONS CALENDARS WHERE MARKED CONFIRMED; OTHERWISE THEY ARE GO MARKETS ESTIMATES. CONSENSUS EPS, REVENUE AND ANALYST-RANGE DATA ARE FROM THIRD-PARTY MARKET CONSENSUS SOURCES, AS OF 14 APRIL 2026 (AEST). COMPANY GUIDANCE, BACKLOG AND OPERATING METRICS ARE FROM THE LATEST COMPANY FILINGS OR RESULTS PRESENTATIONS UNLESS STATED OTHERWISE. FIGURES AND SCHEDULES MAY CHANGE WITHOUT NOTICE.

$TSLA | Q1 2026 REPORTING PERIOD

Tesla Inc.

NASDAQ | Consumer Discretionary | 22 Apr 2026
Confirmed

Global Release Countdown (AMC)

00:00:00:00
Consensus EPS
US$0.41
Consensus Revenue
US$22.26bn
AU/ASIA 23 Apr | 6:05 am
US/LATAM 22 Apr | 4:05 pm
Market Intelligence: $TSLA

Analysis: Tesla price drivers and scenarios

Auto Gross Margin
17-19%
Target floor, excl. credits
Megapack Growth
+25% YoY
Projected energy deployment
Analyst range
US$0.32-0.48
EPS estimate range
AVG
LOW US$0.32 AVG US$0.41 HIGH US$0.48

The US$0.16 analyst range shows there is still a lot of uncertainty. The main question is how weaker vehicle deliveries compare with stronger, higher-margin energy storage contributions. A result above US$0.48 would suggest the autonomy and battery story is improving faster than the bear case expects.

Key factors that could move the result

Automotive gross margin
This is the most important number for Tesla’s core business. Markets want to see whether price cuts have started to settle, or whether margins are still under pressure.
Benchmark: 17% (excluding credits)
Energy storage (Megapacks)
This is the more durable growth story. Strong Megapack deployment and battery margins could help offset weaker vehicle deliveries
Focus: Storage growth versus pressure in the auto business
Full Self-Driving (FSD) & Robotaxi
This is the main narrative driver. Markets will watch for updates on FSD adoption and the robotaxi timeline to judge whether the move towards “physical AI” is becoming more credible.
Watch: Timing for next-generation autonomy technology
Regulatory credits
This is a quality check on the result. If EPS is boosted too much by credit sales, some traders may see the beat as less durable.
Watch: How much credit sales contribute to final EPS
Trade Execution: $TSLA

Earnings reaction framework: Q1 2026

Bull case
EPS above US$0.45, energy margins at 20%+ | FSD take rates rising
The result clears the top-tier analyst range. Commentary focuses on FSD scaling and Megapack production ramps rather than vehicle discounting. FY26 guidance is reaffirmed.
Possible reaction: stronger momentum, with short covering adding support
Base case
EPS between US$0.38 and US$0.43, auto margins stable | Near target
The result is close to expectations, but there is no major surprise from the energy business. The market stays focused on the robotaxi timeline. The initial move may be limited if the product mix looks unchanged.
Possible reaction: range-bound trading or a muted early response
Bear case
EPS below US$0.35, auto margins drop below 16% | Signs of FSD delays
The result misses even cautious expectations. Rising inventory suggests more discounting may be needed. The market starts to question whether the level of spending on AI and autonomy is too high.
Possible reaction: rotation out of the stock, especially if growth confidence weakens
Sentiment Analysis · Tesla Inc.

Interactive scenario analysis: $TSLA

Select earnings outcome
Growth momentum

Strong result, helped by energy and FSD

FSD and Energy do better than expected, which helps offset weaker car deliveries. Management gives the market more confidence that autonomy is getting closer to real revenue. Auto margins staying above 17% would also help.
EPS Outcome
Above US$0.45
Energy Signal
On track
Margins
At or above 17%
Possible reaction
Strong rally

Sources & Data Methodology Sources: Reporting dates and release times are from company investor relations calendars where marked Confirmed; otherwise they are GO Markets estimates. Consensus EPS, revenue and analyst-range data are sourced from Bloomberg and Earnings Whispers, as at 14 April 2026 (AEDT). Company guidance, backlog and operating metrics are sourced from the latest company filings, results presentations or investor relations materials unless stated otherwise. Any scenario analysis reflects GO Markets analysis. Figures and schedules may change without notice.

Expanded Coverage

AI isn’t the only trade this earnings season.

From data centres to defence, see why JPMorgan and the big defence players are on our radar for March.

From autonomy to electricity

If Tesla is the market’s test of whether physical AI can become a business, NextEra is a test of whether the power buildout behind AI is starting to show up more clearly in utility economics.

That is what makes the shift from Tesla to NextEra interesting: one is about ambition and platform narrative and the other is about power, contracts, infrastructure and return on capital.

$NEE | Q1 2026 REPORTING PERIOD

NextEra Energy, Inc.

NYSE | Utilities | 23 Apr 2026
Confirmed

Global Release Countdown (BMO)

00:00:00:00
Consensus EPS
US$0.91
Consensus Revenue
US$7.17bn
AU/ASIA 23 Apr | 9:35 pm
US/LATAM 23 Apr | 7:35 am
Market Intelligence: $NEE

Analysis: NEE price drivers and scenarios

Backlog
About 29.8 GW
Total Energy Resources backlog
Growth target
8%+ a year
Adjusted EPS growth through 2032
Analyst range
US$0.88-1.06
Q1 EPS estimate range
AVG
LOW US$0.88 AVG US$0.92 HIGH US$1.06

The main question is simple: can NextEra turn big growth plans into real progress? Traders want to see whether rising power demand, especially from AI, is starting to show up in results, contracts and project execution.

Trade Execution: $NEE

Key signals to watch

Contract conversion
One of the biggest proof points. Markets want to see whether strong customer interest is turning into signed agreements and clearer revenue visibility.
Signal: More large-load agreements signed
Natural gas and power buildout
Traders will watch for clearer milestones on the approved gas buildout and capacity plan to meet rising power demand.
Focus: Buildout timeline and project execution
Funding and capital discipline
Investors will want to know whether funding plans look manageable after the recent equity raise and the impact of financing costs.
Watch: Funding risk and capital pressure
Rate base and earnings outlook
Markets look for healthy rate-base growth and signs that rising demand can support long-term earnings growth.
Focus: Guidance, rate-base growth and EPS visibility
Sentiment Analysis · NextEra Energy

Interactive scenario analysis: $NEE

Select earnings outcome
Upside momentum

Strong result, backed by real progress

EPS comes in above US$1.06. Management shows better contract progress and clearer steps on new power projects. That would suggest the backlog is moving closer to real revenue.
EPS Outcome
Above US$1.06
Infrastructure Signal
More contracts signed
Possible reaction
Sentiment improves
Sources & Data Methodology

Sources: Reporting dates and release times are from company investor relations calendars where marked Confirmed; otherwise they are GO Markets estimates. Consensus EPS, revenue and analyst-range data are sourced from Bloomberg and Earnings Whispers, as at 14 April 2026 (AEDT). Company guidance, backlog and operating metrics are sourced from the latest company filings or results presentations. Any scenario analysis reflects GO Markets analysis. Figures and schedules may change without notice.

From power to oil

If NextEra reflects the electricity side of the real economy story, Exxon Mobil reflects the fuel side. That matters in a market where supply risk can still reset inflation expectations, shift sector leadership and change how traders think about defensiveness.

$XOM | Q1 2026 REPORTING PERIOD

Exxon Mobil Corporation

NYSE | Energy | 1 May 2026
Confirmed

Global Release Countdown (BMO)

00:00:00:00
Consensus EPS
US$1.66
Consensus Revenue
US$82.47bn
AU/ASIA 1 May | 8:30 pm
US/LATAM 1 May | 6:30 am
Market Intelligence: $XOM

Analysis: XOM price drivers and scenarios

Liquids pricing effect
US$1.9-2.3bn
Support from stronger oil prices
Energy products timing
-US$3.3-4.1bn
Downstream timing drag
Analyst range
US$1.60-$1.85
Q1 EPS estimate range
AVG
LOW US$1.60 AVG US$1.66 HIGH US$1.85

The key question for Exxon Mobil is straightforward: can stronger oil and gas pricing offset weaker volumes and downstream pressure? For traders, this is a test of earnings quality, if prices do the lifting, the market may still want proof that operations are holding up.

Trade Execution: $XOM

Key signals to watch

Realised pricing
Markets want to see whether stronger oil and gas prices were enough to offset weaker production volumes.
Signal: Price strength vs Volume pressure
Timing and quality
Commentary on whether the downstream timing drag is temporary or a sign of deeper margin pressure.
Focus: Accounting effect vs Headwind
Guyana and Upstream
Markets want steady production growth from Guyana to keep the long-term story intact.
Watch: Delivery and Resilience
Refining margins
Even if crude helps, weaker refining or chemicals performance could limit the overall upside.
Focus: Downstream offset levels
Sentiment Analysis · Exxon Mobil

Interactive scenario analysis: $XOM

Select earnings outcome
Pricing offsets disruption

Strong result, with pricing support doing enough

EPS above US$1.85. Higher realised pricing more than offsets weaker volumes, and management suggests timing drag was less severe than expected. Upstream updates stay constructive.
EPS Outcome
Above US$1.85
Timing Impact
Smaller than feared
Possible reaction
Sentiment improves
Sources & Data Methodology

Sources: Reporting dates from company investor relations calendars; otherwise they are GO Markets estimates. Consensus EPS, revenue and analyst-range data from Bloomberg and Earnings Whispers as at 14 April 2026 (AEDT). Any scenario analysis reflects GO Markets analysis. Figures and schedules may change without notice.

The Bottom Line

The 2026 Reality Check

This late-April energy cluster is about more than three company reports. It is a live test of what the market wants to pay for in 2026.

Tesla ($TSLA)

Autonomy and energy shifting from promise to proof.

NextEra ($NEE)

Electricity demand turning into practical utility growth.

Exxon ($XOM)

Oil strength translating into durable earnings power.

Taken together, they offer a useful read on the part of the market that looks more physical, more capital-intensive and, for many traders, more real.

Your next earnings setup starts here

Stay ahead of major beats, misses, and market surprises. Log in to your terminal, open a new account, or explore our dedicated earnings academy.

Need help? Contact our support team

GO Markets
April 15, 2026
US Earnings
AI
Defensa, disrupción y grandes finanzas: 3 nombres que vale la pena ver esta temporada de ganancias

Entonces aquí está la cosa: la temporada de ganancias en Estados Unidos de abril está llegando a un mercado que aún se siente cualquier cosa menos normal. Como explica GO Markets en El manual global de ganancias de Estados Unidos: la guía esencial para los comerciantes, este periodo sobre el que se informa está aterrizando después de un cambio real en lo que a los mercados les importa. Ya no se trata solo de perseguir el crecimiento a cualquier costo. Se trata de lo que dicen los números debajo de la superficie.

Y en 2026, esas señales están chocando con un telón de fondo de alta fricción:

  1. Conflicto geopolítico: Tensión continua en Oriente Medio
  2. Choque de suministro de aceite: Crudo Brent por encima de US$100
  3. La Fed: Un banco central sigue encerrado por una inflación pegajosa

El pivote de durabilidad

Sí, la IA sigue siendo la historia principal del mercado pero sigue siendo el motor llamativo que recibe la mayor parte de la atención. Pero debajo de eso, hay un movimiento más silencioso hacia empresas que parecen construidas para aguantar mejor cuando las condiciones se vuelven más difíciles.

Cuando las tarifas son inciertas y los mercados energéticos están bajo presión, nombres como JPMorgan Chase y los principales contratistas de defensa comienzan a tener más peso. No están reemplazando la narrativa de IA, más bien, se están convirtiendo en parte de la forma en que los comerciantes leen el apetito de riesgo, la durabilidad de las ganancias y, en última instancia, donde el mercado busca algo más sólido a lo que aferrarse.

! Important: Reporting schedules can change without notice. Reporting dates and release times are from company investor relations calendars where marked Confirmed; otherwise they are GO Markets estimates. Consensus EPS, revenue and analyst-range data are from third-party market consensus sources, as of 7 April 2026 (AEDT). Company guidance, backlog and operating metrics are from the latest company filings or results presentations unless stated otherwise. Figures and schedules may change without notice.
$JPM | Q1 2026 REPORTING PERIOD

JPMorgan Chase & Co.

NYSE | Financial Services | 14 Apr 2026
Confirmed

Global Release Countdown (BMO)

00:00:00:00
Consensus EPS
US$5.42
Consensus Revenue
US$47.88bn
AU/ASIA 14 Apr | 8:45 pm
US/LATAM 14 Apr | 6:45 am
Market Intelligence: $JPM

Analysis: JPM price drivers and scenarios

NII guidance
~US$103 billion
Full year | US$95 billionn ex:markets
ROTCE target
17%
Possible return on tangible common equity
Analyst range
US$5.02-5.70
Low to high estimate spread
AVG
LOW US$5.02 AVG US$5.39 HIGH US$5.70

The analyst spread of US$0.68 signals genuine disagreement about how the rate environment is flowing through to margins. A result above consensus but below the high end estimate may produce a muted reaction. A result above US$5.70 may shift the discussion.

Key swing factors for the result

Net interest income (NII)
The clearest macro lever. It reflects the gap between lending rates and deposit costs.
Guidance: US$103 billion for the full year
Return on tangible common equity (ROTCE)
A scale check. It indicates whether JPM is converting scale into efficiency. 17% is the benchmark.
Target: 17% ROTCE
Trading and investment banking
Strong Q1 growth was expected in fees and markets revenue. These lines can offset softness in lending, and stronger-than-expected performance here may shift the narrative away from rate sensitivity.
Watch: investment banking (IB) fees versus the prior quarter
Expense discipline
A bank can beat the EPS estimate and still sell off if expense growth is running too hot. Pairing the EPS result with the expense trajectory gives a fuller read on whether the beat is durable.
Watch: Expense outlook commentary
Trade Execution: $JPM

Earnings reaction framework: Q1 2026

Bull case
EPS above US$5.70, NII on track | ROTCE at or above 17%
The result comes in above the top of the analyst range. NII guidance holds or is revised higher. IB fees and markets revenue show strong Q1 growth. Expense commentary is constructive.
Possible reaction: momentum and repositioning
Base case
EPS between US$5.39 and US$5.70, NII in line | ROTCE near target
The result beats consensus but stays within the expected range. NII tracks guidance. The tone of the conference call may matter more than the headline number. The first move may fade if guidance is unchanged.
Possible reaction: muted or mixed initial response
Bear case
EPS below US$5.39 | NII misses | Expense growth surprises
The result comes in at or below the consensus midpoint. NII guidance is cut or qualified. Expense growth comes in above market expectations. IB or markets revenue disappoints.
Possible reaction: earnings multiple repricing

Reaction trigger to watch: The market response in the first 30 minutes after the result may indicate which scenario traders are leaning towards. A move above the prior session high on volume may support the bull case. A fade back into the range after an initial pop may point to the base case. A break below the prior session low on volume may suggest the bear case is gaining traction.

Sentiment Analysis · JPMorgan Chase

Interactive scenario analysis: $JPM

Select earnings outcome
Growth momentum

AI-linked offset, beat supported by NII and ROTCE

Stronger-than-expected demand for AI-related industrial lending may offset softer mortgage activity. Management maintains guidance as NII remains resilient in higher-for-longer conditions. IB fees and markets revenue may provide additional support. ROTCE at or above 17% would suggest the bank is converting scale into earnings efficiently.
EPS Outcome
Above US$5.70
NII Signal
On track
ROTCE
At or above 17%
Likely Reaction
Momentum may build

Sources & Data Methodology Sources: Reporting dates and release times are from company investor relations calendars where marked Confirmed; otherwise they are GO Markets estimates. Consensus EPS, revenue and analyst-range data are sourced from Bloomberg and Earnings Whispers, as at 7 April 2026 (AEDT). Company guidance, backlog and operating metrics are sourced from the latest company filings, results presentations or investor relations materials unless stated otherwise. Any scenario analysis reflects GO Markets analysis. Figures and schedules may change without notice.

From credit to defence

If JPMorgan gives the market an early read on the consumer, credit quality and business activity, the defence names may be telling a different story. This is the point where the focus may start to shift from the credit cycle to government-backed demand.

In a market still shaped by geopolitical risk, that matters. Long-dated programs can help support revenue visibility, even when the broader outlook looks less certain. That is one reason the sector remains on the watchlist.

$LMT | Q1 2026 REPORTING PERIOD

Lockheed Martin Corp.

NYSE | Aerospace | Defense | 22 Apr 2026
Estimated

Global Release Countdown (BMO)

00:00:00:00
Consensus EPS
US$6.50
Consensus Revenue
US$16.32bn
AU | ASIA 22 Apr | 9:20 pm
US | LATAM 22 Apr | 7:20 am
Market Intelligence: $LMT

Analysis: LMT price drivers and scenarios

Order backlog
US$194 billionn
Record visibility
Book-to-bill
1.2x
Orders outpacing sales
Analyst range
US$6.90-7.10
Low to high estimate spread
AVG
LOW ~US$6.90 AVG ~US$6.94 HIGH US$7.10+

The consensus sits near the lower end of the analyst range. That positioning may leave room for upside if backlog growth and F-35 delivery timelines support execution. A print near the high end, above US$7.10, may extend the move, although the reaction would still depend on guidance and margins.

Key swing factors for the result

Backlog visibility
Primary evidence of demand. Book-to-bill above 1.2x would support full-year guidance and the production ramp.
Backlog: US$194 billion record
Free cash flow (FCF)
Defence stocks are often assessed on cash conversion. The market may look for confirmation of the US$6.5 billion floor.
Guide: US$6.5 billion - $6.8 billion
Missile segment growth
PrSM and THAAD deliveries remain key watchpoints. Strong space margins may help offset softness in aeronautics.
Watch: Fire Control margins
Margin pressure
Pension charges and production inflation remain risks. An earnings beat may fade if operating margins contract.
Watch: segment operating margin
Trade Execution: $LMT

Earnings reaction framework: Q1 2026

Bull case
EPS above US$6.70, backlog visibility confirmed | FCF guide holds
The result clears the upper half of the analyst range. Management reaffirms or raises the full-year FCF outlook. Strong Missiles and Fire Control (MFC) margins help offset any aeronautics supply chain lag.
Possible reaction: momentum may build and positioning may improve
Base case
EPS between US$6.30 and US$6.70 | Backlog steady at about US$194 billion
The result aligns with the US$6.38 consensus. F-35 delivery pace remains on track but offers no meaningful upside surprise. The market may wait for more specific segment guidance on the conference call.
Possible reaction: muted or mixed initial response
Bear case
EPS below US$6.30 | FCF guide qualified, margin contraction
The result falls towards the bottom of the analyst spread. Management cites further software delays or program losses. The FCF trajectory narrows towards the lower end of previous expectations.
Possible reaction: the share price may come under pressure

Reaction trigger to watch: The market response in the first 30 minutes after the result may indicate which scenario traders are leaning towards. A move above the prior session high on volume may support the bull case. A fade back into the range after an initial pop may point to the base case. A break below the prior session low on volume may suggest the bear case is gaining traction.

Sentiment Analysis · Lockheed Martin

Interactive scenario analysis: $LMT

Select earnings outcome
Backlog confirmed

Backlog and FCF confirmation may support continuation

EPS clears the top of the analyst range. Backlog holds at or above US$194 billion and book-to-bill stays above 1.2, which would suggest orders are replenishing faster than revenue is being recognised. FCF guidance holds within the stated range.
EPS outcome
Above US$7.00
Backlog signal
Above US$194 billion
FCF guide
Holds or improves
Likely reaction
Continuation may follow

Sources & Data Methodology Sources: Reporting dates and release times are from company investor relations calendars where marked Confirmed; otherwise they are GO Markets estimates. Consensus EPS, revenue and analyst-range data are sourced from Bloomberg and Earnings Whispers, as at 7 April 2026 (AEDT). Company guidance, backlog and operating metrics are sourced from the latest company filings, results presentations or investor relations materials unless stated otherwise. Any scenario analysis reflects GO Markets analysis. Figures and schedules may change without notice.

Not all defence names are the same

Lockheed Martin and Northrop Grumman may sit in the same defence bucket, but the market does not always read them the same way. Lockheed is more closely tied to the F-35 and current air combat demand. Northrop is more closely linked to next-generation programs such as the B-21 Raider and Sentinel.

That gives this section its contrast. One is often read through the lens of current defence demand. The other is more closely tied to longer-cycle strategic modernisation.

$NOC | Q1 2026 REPORTING PERIOD

Northrop Grumman Corp.

NYSE | Defense | Space Systems | 23 Apr 2026
Estimated

Global Release Countdown (BMO)

00:00:00:00
Consensus EPS
US$6.12
Consensus Revenue
US$10.24 bn
AU | ASIA 23 Apr | 10:30 pm
US | LATAM 23 Apr | 8:30 am
Market Intelligence: $NOC

Analysis: NOC price drivers and scenarios

Consensus EPS
US$6.96
Quarterly analyst average
Order Backlog
US$95.7 billion
Record revenue visibility
FY 2026 EPS guide
US$27.40-US$27.90
Full-year 2026 outlook
AVG
LOW ~US$6.90 AVG ~US$6.96 HIGH US$7.20+

The consensus sits near the lower end of the analyst range. That offers a quick visual for whether the result is merely in line or strong enough to ease the guidance concerns that weighed on the stock after its last update. A result above US$7.20 may shift the conversation more materially.

Key swing factors for the result

Book-to-bill ratio
Currently at 1.10, suggesting orders are still running ahead of revenue recognition. This remains an important signal for multi-year growth visibility in defence.
Watch: 1.10 target
Guidance reset risk
Management’s guidance previously came in below market expectations. The market may be sensitive to any further softening in the 2026 outlook.
Watch: guidance commentary
Program concentration
The B-21 Raider and Sentinel carry outsized execution sensitivity. Updates on production ramp and funding may be the clearest drivers of sentiment for the stock.
Watch: B-21 and Sentinel updates
Capacity investment
Higher capital expenditure (capex) supports the industrial base over the longer term, but it may pressure near-term margins. Watch for signs that current investment is weighing on earnings power.
Watch: operating margins
Trade Execution: $NOC

Earnings reaction framework: Q1 2026

Bull case
EPS above US$6.30, backlog expansion above US$96 billion | Free cash flow (FCF) guidance raised
The result comes in above the cited threshold. Management says B-21 Raider production is ahead of schedule, with improving margins. Sentinel program restructuring costs remain below baseline expectations. International awards lift the book-to-bill ratio above 1.15.
Possible reaction: momentum may improve
Base case
EPS between US$6.00 and US$6.20, backlog steady at about US$95.7 billion
The result is broadly in line with the cited range. FCF targets for 2026 are reaffirmed but not expanded. Market focus shifts to organic sales growth metrics and segment operating margins. The initial reaction may depend on the timing of B-21 milestone payments.
Possible reaction: little reaction
Bear case
EPS below US$5.95 | margin pressure, guidance narrowed
The result lands near the low end of the analyst spread. Management flags higher infrastructure costs for Sentinel or delays in restricted space segment awards. Margin pressure in Aeronautics persists, and the 2026 revenue guide narrows towards the US$43.5 billion floor.
Possible reaction: shares may weaken

Reaction trigger to watch: The market response in the first 30 minutes after the result may indicate which scenario traders are leaning towards. A move above the prior session high on volume may support the bull case. A fade back into the range after an initial pop may point to the base case. A break below the prior session low on volume may suggest the bear case is gaining traction.

Sentiment Analysis · Northrop Grumman

Interactive scenario analysis: $NOC

Select earnings outcome
Stealth momentum

B-21 momentum, stronger execution and FCF support

EPS clears US$6.15. Management confirms a production capacity agreement for the B-21 Raider. Sentinel restructuring reaches Milestone B on schedule. Record backlog visibility and higher FCF guidance towards US$3.5 billion may support broader repositioning.
EPS outcome
Above US$6.15
B-21 Signal
Acceleration
FCF guide
$3.5 billionn range
Likely reaction
Momentum rally

Sources & Data Methodology Sources: Reporting dates and release times are from company investor relations calendars where marked Confirmed; otherwise they are GO Markets estimates. Consensus EPS, revenue and analyst-range data are sourced from Bloomberg and Earnings Whispers, as at 7 April 2026 (AEDT). Company guidance, backlog and operating metrics are sourced from the latest company filings, results presentations or investor relations materials unless stated otherwise. Any scenario analysis reflects GO Markets analysis. Figures and schedules may change without notice.

Bottom line

In a market shaped by geopolitical risk and shifting rate expectations, companies with visible demand and longer-cycle revenue may continue to attract attention. But sentiment can still turn quickly if valuations are stretched, rate expectations shift again, or tensions in the Middle East ease.

That is why the story still needs to be tested against the numbers, not just the narrative. GO Markets will be analysing more companies throughout this earnings season. For more updates, visit our earnings page, follow our social media channels, or check the weekly newsletters.

Your next earnings setup starts here

Stay ahead of major beats, misses, and market surprises. Log in to your terminal, open a new account, or explore our dedicated earnings academy.

Need help? Contact our support team

GO Markets
April 7, 2026
US Earnings
Shares
El manual global de ganancias de Estados Unidos: la guía esencial para los comerciantes

Si ha estado observando los mercados durante el último año, habrá notado que la era del “crecimiento a cualquier costo” efectivamente ha chocado contra una pared. El ciclo de ganancias de abril de 2026 llega en un momento en que el foco del mercado ha sufrido una reorientación estructural. Ya no se trata solo de estados de pérdidas y ganancias. Se trata de las señales que se sientan detrás de ellos.

Con la incertidumbre de las tasas de interés persistente y los choques geopolíticos que empujan al petróleo por encima de los 100 dólares, el manual de jugadas ha pasado de la exageración de la IA hacia la resiliencia institucional y la industrialización de la computación. Para los comerciantes de Australia, Asia y América Latina, estos resultados pueden actuar como un anillo de ánimo para el apetito de riesgo global y el emergente superciclo de seguridad.

Important - Dates, Times and Figures

All earnings dates marked as confirmed or estimated should be verified against current company investor relations calendars before you act on them. Reporting schedules can change without notice due to corporate decisions, regulatory requirements or exchange timetable adjustments.

The mechanics: How the timing works across time zones

The US earnings season does not arrive as a smooth drip. It arrives in waves. For non-US traders, the primary challenge is the overnight gap: major results land while you are away from your desk and can move index CFDs before your local market opens. Before market open (BMO) and after market close (AMC) matter just as much as the numbers themselves. The timing changes how quickly markets react, when liquidity is available and whether the first move has already happened before your session begins.

Por qué son importantes las BMO y AMC

Un resultado de BMO golpea antes de que se abra el mercado de efectivo estadounidense, por lo que el descubrimiento de precios ocurre en las operaciones previas al mercado donde la liquidez es más delgada y los movimientos pueden ser exagerados. Un resultado de AMC golpea después del cierre, lo que significa que la reacción se comprime en una breve ventana previa a la comercialización a la mañana siguiente. Entender en qué ventana reporta tu empresa es tan importante como entender lo que reporta.

Institutional Grade Performance

Master the Markets with MetaTrader 5

Trade hundreds of instruments with superior speed and advanced technical analysis. Harness full EA functionality to execute your strategy.

Need to access your terminal? Log in to Client Portal

The key themes for Q1

For this cycle, the market is no longer rewarding AI mentions alone. It is looking for return on investment (ROI) proof. The four thematic snapshots below help explain where attention is likely to sit as results come through. Each theme has its own section with company cards that can be updated each quarter.

T1
Theme 1 — Institutional anchors

Defence against volatility

These companies are often watched as relative defensives during energy shocks and inflation spikes, although they remain exposed to normal share-price risk. When macro uncertainty rises, money has historically rotated toward businesses with contracted revenue, government-linked demand or pricing power that is not dependent on the consumer cycle — but past rotation patterns do not guarantee future performance.

JPM
JPMorgan Chase
Tuesday, 14 April Confirmed
Watch For

Net interest margin (NIM) under higher for longer rates, and whether AI spending remains cost neutral.

LMT
Lockheed Martin
Wednesday, 22 April Estimated
Watch For

F-35 delivery schedules and the company's ability to absorb tariff related costs on supply chain inputs.

NOC
Northrop Grumman
Monday, 27 April Confirmed
Watch For

B-21 Raider production progress and the conversion of its reported US$95.7 billion backlog into recognised revenue.

T2
Theme 2 — Tangible capital

EVs and energy

As parts of tech slow, investors have been rotating toward tangible, capital-intensive businesses. The energy transition and the infrastructure required to support AI data centre power demand have put utilities and energy companies in an unusual position: they are now growth stocks with defensive characteristics — though all remain subject to ordinary equity and sector risk.

TSLA
Tesla
Thursday, 23 April Confirmed
Watch For

The strategic shift from EV margins toward robotaxi and energy storage as the new growth narrative.

NEE
NextEra Energy
Friday, 24 April Estimated
Watch For

Data centre power demand and progress on its reported 30 GW contracted backlog as utilities face new infrastructure pressure.

XOM
Exxon Mobil
Wednesday, 29 April Estimated
Watch For

Permian and Guyana volume growth, and cash flow resilience during the Hormuz supply disruption.

T3
Theme 3 — The hardware invoice phase

AI infrastructure

This is the engine room of the S&P 500 and the part of the market most tied to whether AI capital expenditure is generating measurable returns. The question the market is now asking is not whether these companies are spending on AI. It is whether the spending is translating into capacity utilisation and revenue that justifies the multiple.

MSFT / GOOGL
Microsoft and Alphabet
Monday, 27 April Estimated
Watch For

Azure and Cloud capacity constraints against heavy AI capital expenditure. The gap between spending and utilisation is the market's primary concern.

NVDA
NVIDIA
Wednesday, 27 May Estimated
Watch For

Blackwell GPU demand and gross margin sustainability as the product cycle matures and competition intensifies.

T4
Theme 4 — K-shaped recovery

Consumer platforms and devices

This theme tests the K-shaped consumer recovery: higher-income cohorts remain more resilient while lower-income cohorts face continued pressure from elevated borrowing costs and energy prices. Ad revenue and device upgrade cycles are the clearest indicators of where on the K-curve the consumer sits.

META / AMZN
Meta and Amazon
28 to 29 April Estimated
Watch For

AI-driven ad click improvements against Reality Labs spending and retail logistics costs as the profitability test for non-core investment.

AAPL
Apple
Thursday, 30 April Estimated
Watch For

iPhone upgrade cycle momentum and the Apple Intelligence rollout in China as the first real-world test of AI-driven hardware demand.

Analysis checklist: how to read each result

Use this structure for every company on your watchlist. A headline beat is common. The bigger market move often comes from how the market translates the details sitting behind the number.

1
Projected consensus

This is the bar for earnings per share (EPS) and revenue. Small beats may already be priced in. The market often sets a whisper number above the published consensus, so a technically positive result can still disappoint.

2
The call focus

Identify the single variable analysts are most focused on this cycle: capital expenditure versus margins, inventory turnover, customer growth rate, or contract backlog conversion.

3
The translation

A beat, meet or miss each carries a different market dynamic.

Beat Matters most when forward guidance is credible. Without it, the initial move may reverse.
Meet Often shifts focus to the tone of the call, particularly language around capacity or outlook.
Miss Can be treated as the start of a trend and trigger a sharp repricing of valuation multiples.

The recency bias problem

The emotional trap many traders fall into is recency bias. Because the Magnificent 7 have led markets for so long, it can feel as though they are still the only trade that matters. That assumption deserves to be tested.

Vale la pena preguntar: ¿El comercio obvio ya tiene un precio para la perfección?

2026 se perfila como un año de pruebas. Ahora se les pide a las empresas que gastaron mucho en IA en los últimos dos años que muestren el retorno. El mercado ya no está recompensando el anuncio de inversión en IA. Está recompensando la evidencia de los resultados de ingresos impulsados por la IA.

Una mejor pregunta de encuadre para cada resultado es esta: ¿está reaccionando a un titular, o está evaluando el papel de la compañía en la cadena de suministro física de IA o como una posible cobertura de volatilidad? Esas son tareas analíticas muy diferentes, y tienden a producir decisiones de posicionamiento muy diferentes.

What to watch next

Three time horizons, three distinct signals. Update these each cycle with the most relevant near-term catalyst, the sector rotation to watch, and the longer-horizon dispersion theme.

Next Two Weeks
Consumer health barometer

Watch the 31 March Nike report as a lead indicator for consumer discretionary health. Footwear and apparel demand signals tend to front-run broader retail sentiment.

Next 30 Days
Bank lending and industrial demand

Focus shifts to the major banks. If loan demand tied to industrial and infrastructure projects remains firm, the earnings cycle may have support beyond the tech sector.

Next 60 Days
Wider dispersion between winners and losers

Watch for dispersion to widen. The companies converting heavy capital expenditure into measurable revenue outcomes may separate clearly from those that cannot.

Client & Education Portal

Follow the US Reporting Season

Stay ahead of major beats, misses, and market surprises. Log in to your terminal, open a new account, or explore our dedicated earnings academy.

Need help? Contact our support team

GO Markets
March 31, 2026
La Fed entra en abril con tasas de 3.50% a 3.75%, el crudo Brent por encima de los 100 dólares y las presiones inflacionarias aún no resueltas del todo. El IPC de marzo, las nóminas, el PIB del primer trimestre y el FOMC del 28 al 29 de abril podrían determinar si los recortes de tasas se mantienen en suspenso durante gran parte de 2026.
Central Banks
Geopolitical events
La Fed vigila abril de 2026: Explicación del petróleo, la inflación y el FOMC

Aquí está la situación como comienza abril. Una guerra está afectando uno de los puntos de choque petroleros más importantes del mundo. El crudo Brent cotiza por encima de los 100 dólares estadounidenses. Y la Reserva Federal (Fed), que pasó gran parte de 2025 ingeniando un aterrizaje suave, ahora enfrenta una amenaza inflacionaria impulsada menos por los salarios, los servicios o la economía doméstica, y más por la energía. Está viendo un choque petrolero.

El tipo de los fondos de la Fed se sitúa en 3.50% a 3.75%. La próxima reunión del Comité Federal de Mercado Abierto (FOMC) es el 28 y 29 de abril y la pregunta clave para los mercados no es si la Fed recortará, es si la Fed puede recortar, o si el choque energético puede haber cerrado esa puerta durante gran parte de 2026.

Una gran cantidad de publicaciones de datos importantes aterriza en abril. El índice de precios al consumidor (IPC) de marzo, las nóminas no agrícolas (PNB) y la estimación anticipada del producto interno bruto (PIB) del primer trimestre son los tres que más importan. Pero el comunicado del FOMC del 29 de abril puede ser el lanzamiento que marque la pauta para el resto del año.

Fed Funds Rate

3.50%–3.75%

Next FOMC

28–29 April 2026

Brent crude

Above US$100

Key data events

12 major releases

Crecimiento: Actividad y demanda del negocio

Piense en cómo se veía la economía estadounidense al entrar este año: el gasto de capital impulsado por la IA (capex) fue una parte importante de la narrativa de crecimiento, las intenciones de inversión corporativa se veían firmes y la Ley One, Big, Beautiful Bill Act ya estaba en la mezcla. Sobre el papel, la historia de crecimiento parecía sólida.

Entonces la situación del Estrecho de Ormuz cambió el cálculo. No porque Estados Unidos sea un importador neto de energía, no lo es, y ese aislamiento estructural importa. Pero lo que es bueno para los productores de energía estadounidenses aún puede exprimir los márgenes en otros lugares y pesar sobre la demanda mundial. Ahora es probable que el avance del 30 de abril la estimación del producto interno bruto (PIB) del primer trimestre se lea a través de dos lentes: qué tan fuerte era la economía antes del shock, y qué podría indicar sobre los trimestres que se avecinan.

Key dates (AEST)

2
Apr
US international trade in goods and services (February)
Bureau of Economic Analysis  ·  10:30 pm AEDT
Medium
30
Apr
Q1 GDP — advance estimate
Bureau of Economic Analysis  ·  10:30 pm AEST
High

What markets look for

  • Resilience in Q1 GDP despite the elevated interest rate environment and early energy cost pressures
  • Trade balance movements linked to shifting global tariff frameworks
  • Business investment intentions following passage of the "One Big Beautiful Bill Act"
  • Early signs of capacity constraints emerging in technology-heavy sectors

How this data may move markets

Scenario Treasuries USD Equities
Stronger than expected growth Yields rise Firmer Mixed - depends on inflation read
Softer growth/GDP miss Yields fall Softer Risk off if stagflation narrative builds

Laborista: Nóminas y empleo

El reporte de empleos de febrero fue, dependiendo de cómo lo leas, ya sea un blip o una señal de advertencia. Las nóminas no agrícolas (NFP) bajaron 92 mil, el desempleo subió a 4.4% y la línea oficial fue que el clima jugó un papel. Eso puede ser cierto pero esto es lo que también sucedió. El mercado laboral de repente se veía un poco menos convincente como el principal argumento para mantener las tasas elevadas.

El informe de empleo del 3 de abril para marzo es ahora genuinamente consecuente. Un rebote al crecimiento positivo de la nómina probablemente estabilizaría los nervios y una segunda letra blanda consecutiva, particularmente en un contexto de mayores precios de la energía, comenzaría a construir una narrativa muy incómoda para la Fed. Estaría viendo un crecimiento más lento del empleo y una amenaza de inflación al mismo tiempo. Ese no es un lugar cómodo para estar.

Key dates (AEST)

3
Apr
March employment situation (NFP and unemployment rate)
Bureau of Labor Statistics  ·  10:30 pm AEDT
High
30
Apr
Q1 employment cost index
Bureau of Labor Statistics  ·  10:30 pm AEST
Medium

What markets look for

  • A return to positive payroll growth, or confirmation that February's softness was the start of a trend
  • Stabilisation or further movement in the unemployment rate from 4.4%
  • Average hourly earnings growth relative to core inflation — the wage-price dynamic the Fed watches closely
  • Weekly initial jobless claims as a real-time signal of whether layoff activity is rising

Inflación: IPC, IPP y PCE

Aquí está la incómoda verdad sobre dónde se encuentra la inflación en este momento. Los gastos básicos de consumo personal (PCE), el indicador preferido de la Fed, ya se ubicaban en 3.1% interanual en enero, antes de que se hubiera alimentado cualquier shock petrolero. La Fed no había resuelto completamente su problema de inflación, más bien, lo había desacelerado. Eso es otra cosa.

Y ahora, además de un problema de inflación no del todo resuelto, los precios del petróleo se han movido bruscamente al alza. Los precios de la energía pueden alimentar el índice de precios al consumidor (IPC) con relativa rapidez, a través de costos de gasolina, transporte y logística que eventualmente pueden aparecer en el precio de casi todo. El impresión del IPC del 10 de abril para marzo es probablemente el lanzamiento de datos individuales más importante del mes, es el que nos puede decir si el choque energético ya está apareciendo en los números que observa la Fed.

Key dates (AEST)

10
Apr
Consumer price index (CPI) — March
Bureau of Labor Statistics  ·  10:30 pm AEST
High
14
Apr
Producer price index (PPI) — March
Bureau of Labor Statistics  ·  10:30 pm AEST
Medium
30
Apr
Personal income and outlays incl. PCE price index — March
Bureau of Economic Analysis  ·  10:30 pm AEST
High

What markets look for

  • Monthly CPI acceleration driven by energy and shelter components — the two stickiest inputs
  • PPI as a forward-looking signal: producer cost pressure tends to feed into consumer prices with a lag
  • PCE trends relative to the Fed's 2% target, particularly the core reading that strips out food and energy
  • Any sign that AI-related pricing power is feeding into corporate margins in ways that sustain elevated core readings

How this data may move markets

Scenario Treasuries USD Gold
Cooling core inflation Yields fall Softer Supportive
Sticky or rising inflation Yields rise Firmer Headwind

Política, comercio y ganancias

Abril es también el inicio de la temporada de ganancias de Estados Unidos, y los resultados de este trimestre tienen una cantidad inusual de peso. Los inversores han estado vertiendo capital en la infraestructura de IA sobre la base de que se avecinan retornos. La pregunta es cuándo. Con la volatilidad geopolítica impulsando una rotación alejada de la tecnología orientada al crecimiento y hacia la energía y la defensa, las ganancias de JPMorgan Chase del 14 de abril se leerán tanto por lo que la gerencia dice sobre el entorno macro como por los propios números.

Después está la reunión del FOMC los días 28 y 29 de abril. Después de la racha de datos de principios de abril, incluyendo PNB, IPC e índice de precios al productor (PPI), la Fed tendrá información más que suficiente para actualizar su lenguaje. Si señala que los recortes de tasas podrían permanecer en suspenso hasta 2026, o si deja la puerta ligeramente entreabierta, puede ser la comunicación más consecuente del trimestre.

La volatilidad geopolítica ya ha empujado a los inversores a reevaluar el posicionamiento de alto crecimiento. La construcción estimada de 650.000 millones de dólares de la infraestructura de IA también está siendo objeto de un escrutinio más intenso en cuanto al retorno de la inversión. Si la temporada de ganancias decepciona en ese frente, y si el FOMC señala una retención prolongada, la combinación podría poner a prueba el apetito de riesgo de cara a mayo.

Monitor this month (AEST)

  • 14 April - JPMorgan Chase Q1 earnings

    The first major bank to report. Management commentary on credit conditions, consumer spending, and the macro outlook will set the tone for financial sector earnings and broader market sentiment.

  • 15 April - Bank of America Q1 earnings

    A read on consumer credit conditions and household financial health, particularly relevant given rising energy costs and the 4.4% unemployment rate.

  • 28-29 April - FOMC meeting and policy statement

    The month's most consequential event. The statement and any updated forward guidance may effectively confirm whether rate cuts remain a possibility for 2026.

  • Ongoing - Strait of Hormuz tanker traffic

    A live indicator of energy supply risk. Any escalation or resolution carries immediate implications for oil prices, inflation expectations, and the Fed's options.

  • Ongoing - Sovereign AI export restrictions

    Developing policy around technology export curbs may affect capital expenditure plans for US technology firms, with knock-on implications for growth and employment in the sector.

The Bigger Picture

Geopolitical volatility has forced a rotation into energy and defence at the expense of growth oriented technology positions. The estimated US$650 billion AI infrastructure buildout is increasingly being scrutinised for returns on investment. If earnings season disappoints on that front, and if the FOMC signals a prolonged hold, the combination could test risk appetite heading into May.

¿Se avecina la publicación de Big US Data? Mantente enfocado.
Abrir una cuenta · Iniciar sesión
GO Markets
March 30, 2026
Market insights
AI
Las 5 principales acciones de semiconductores en Asia: los mayores beneficiarios de IA

Asia domina la oferta mundial de semiconductores. Cinco empresas, que abarcan Taiwán, Corea del Sur y Japón, se sientan en la coyuntura crítica del Construcción de IA, controlando todo, desde la fabricación hasta el equipo que hace posibles los chips.

Datos rápidos

  • TSMC entregó 90 mil millones de dólares en ingresos en 2024, con un margen bruto del 59% y las acciones subiendo 55% en 2025.
  • Las acciones de Advantest se duplicaron (+102%) en 2025 a medida que aumentó la demanda de pruebas de chips impulsadas por IA.
  • SK Hynix es el principal proveedor de HBM de Nvidia, posicionándolo en el centro del boom del acelerador de IA.

1. Taiwán Semiconductor Manufacturing Co. (TSM)

TSMC es el mayor fabricante de chips por contrato del mundo, produciendo semiconductores avanzados para Apple, Nvidia, AMD y Qualcomm. Al ser una fundición de juego puro, lidera en la producción de chips de 5 nanómetros (5nm) y 3 nanómetros (3nm), con nodos más pequeños en desarrollo.

La compañía registró 90 mil millones de dólares en ingresos para 2024 con un margen bruto de 59% y 36% de retorno sobre el capital.

Las acciones arrojaron un retorno total del 55% en 2025, y los analistas pronosticaron un aumento adicional de ~ 30% en los ingresos en 2026, apuntalado por su programa de expansión de 100 mil millones de dólares en Estados Unidos.

El riesgo clave para la compañía es su exposición geopolítica, y las tensiones del Estrecho de Taiwán siguen siendo el riesgo de cola más visto del sector.

Qué ver

  • Progreso de expansión en Estados Unidos: Cualquier retraso, reventada de costos o fricción política con respecto a la inversión de TSMC en Arizona de 100 mil millones de dólares podría pesar sobre el sentimiento.
  • Visibilidad de pedidos del cliente: Esté atento a las actualizaciones de orientación de Apple, Nvidia o AMD sobre pedidos de chips, ya que los ingresos de TSMC están altamente concentrados entre un puñado de clientes.
  • Evolución geopolítica: Cualquier escalada de las tensiones en el Estrecho de Taiwán podría desencadenar movimientos bruscos independientemente de los fundamentos.
  • Rampa de siguiente nodo: El progreso en la producción de 2 nm y las tasas de rendimiento serán una señal clave para la capacidad de TSMC para mantener su liderazgo tecnológico.

2. Samsung Electronics (KR:005930)

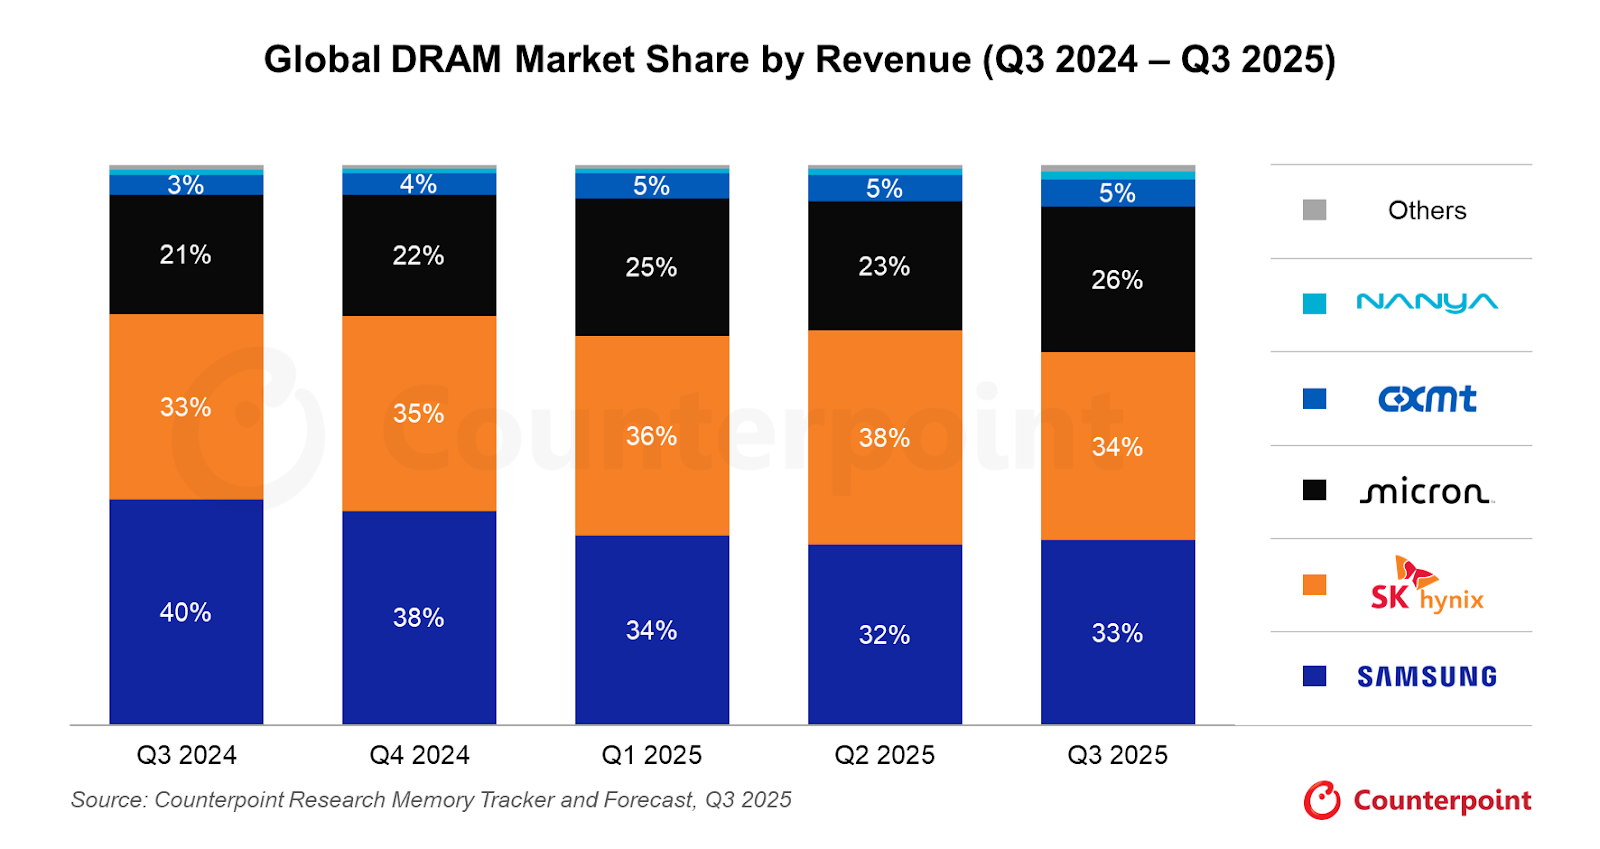
Samsung es una de las pocas empresas a nivel mundial que diseña y fabrica chips a escala. Compite en los segmentos de DRAM, NAND flash y chip lógico, y sigue siendo un proveedor principal para los gigantes tecnológicos globales.

El amplio alcance de Samsung es una fortaleza, pero también una complejidad. Su división de memoria se enfrenta a la presión de los márgenes de los ciclos de inventario, mientras que su negocio de fundición continúa rezagando a TSMC en rendimientos de vanguardia.

El auge de la memoria impulsado por la IA puede proporcionar un viento de cola, aunque la ejecución en la producción de HBM ha sido más lenta que la de su rival local SK Hynix.

Qué ver

  • Progreso de la calificación de HBM: Samsung ha estado trabajando para calificar sus chips HBM3E con Nvidia. Cualquier confirmación de una importante ganancia en la oferta podría ser un catalizador significativo.
  • Tendencias de precios de memoria: Los precios al contado DRAM y NAND podrían ser un indicador de la trayectoria de margen de Samsung.
  • Mejoras en el rendimiento de la fundición: El negocio de fundición lógica de Samsung ha tenido problemas con los rendimientos en nodos avanzados; cualquier progreso creíble aquí podría volver a calificar la división.
  • Orientación de administración: Después de un período de volatilidad de las ganancias, se observará de cerca la claridad sobre los planes de capital y los objetivos divisionales en los próximos resultados.
Fuente: Investigación de contrapunto

3. Ventajas (ATEYY)

Advantest, con sede en Tokio, fabrica equipos de prueba utilizados para verificar que los chips cumplan con los estándares de rendimiento y calidad.

Suministra a Samsung, Intel, Nvidia, Qualcomm y Texas Instruments, lo que le permite beneficiarse del crecimiento de la industria de chips en general, independientemente de qué fundición gane participación de mercado.

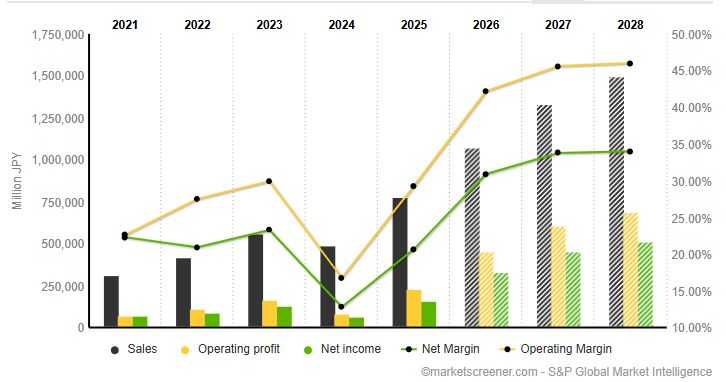
Las acciones de Advantest se duplicaron en 2025 (+102%), y elevó su pronóstico de ventas en 21.8% y su pronóstico de ganancias en 70.6% para el año que termina marzo de 2026.

Qué ver

  • Solicitar actualizaciones del backlog: Cualquier contracción en la acumulación de Advantest podría ser una señal de alerta temprana después de la fuerte racha de 2025.
  • Demanda de pruebas de chips de IA: A medida que los chips se vuelven más complejos, aumenta el tiempo de prueba por chip. Monitoree si los volúmenes del acelerador de IA de TSMC y Samsung comienzan a impulsar una demanda de pruebas desmedida.
  • Orientación para el año fiscal 2026: La próxima actualización del pronóstico será fundamental para confirmar si el ciclo de upgrade de 2025 aún debe ejecutarse.
Cuenta de resultados proyectados Advantest | Cribador de mercados

4. Tokyo Electron (T: 8035)

Tokyo Electron es uno de los mayores proveedores mundiales de equipos de producción de semiconductores, especializado en herramientas de deposición, grabado y limpieza.

Todos los principales fabricante de chips, incluidos TSMC, Samsung y SK Hynix, dependen de los sistemas de TEL para escalar la producción.

A medida que los fabricantes de chips invierten miles de millones para ampliar la capacidad, la libreta de pedidos de TEL crece. El riesgo radica en las posibles restricciones de exportación de Estados Unidos a la venta de equipos avanzados a China, que sigue siendo uno de los principales segmentos de ingresos para la compañía.

Qué ver

  • Política de control de exportaciones de Estados Unidos: China representa una parte significativa de los ingresos de TEL. Cualquier endurecimiento de las normas de exportación de equipos es el riesgo más inmediato de vigilar.
  • Anuncios de Capex de Chipmaker: Los planes de gastos de capital de TSMC, Samsung y SK Hynix para 2026 se traducen directamente en pedidos de equipos. Cualquier corte podría fluir a través de la libreta de pedidos de TEL.
  • Nuevos ciclos de adopción de herramientas: Supervisar si las herramientas de deposición y deposición de próxima generación de TEL se están adoptando en las instalaciones de vanguardia.

5. SK Hynix (KR:000660)

SK Hynix es el segundo fabricante de chips de memoria más grande del mundo y se ha convertido en posiblemente el beneficiario más claro de la era de la IA en el espacio de la memoria.

Es el principal proveedor de chips de memoria de ancho de banda alto (HBM) de Nvidia, la memoria especializada utilizada en aceleradores de IA como el H100 y el B200.

La demanda de HBM ha impulsado una recalificación dramática del perfil de ingresos y la posición en el mercado de SK Hynix. Con el gasto en infraestructura de IA mostrando pocas señales de desaceleración de cara a 2026, la franquicia HBM de la compañía podría seguir siendo un diferenciador clave.

No obstante, las limitaciones de capacidad y el riesgo de que Samsung y Micron cierren la brecha de HBM son las principales preocupaciones a tener en cuenta.

Qué ver

  • Relación de suministro de Nvidia: Cualquier cambio en la mezcla de proveedores de Nvidia hacia Samsung o Micron podría ser un evento de riesgo clave.
  • Desarrollo HBM4: La carrera hacia la próxima generación de HBM ya está en marcha. Esté atento a las actualizaciones sobre la preparación HBM4 de SK Hynix y si puede mantener su liderazgo.
  • Precios de memoria convencionales: SK Hynix aún obtiene ingresos significativos de DRAM y NAND estándar. Las tendencias de los precios al contado podrían ser un indicador del ciclo de memoria más amplio.

Conclusión

TSMC, SK Hynix, Samsung, Advantest y Tokyo Electron controlan colectivamente los puntos de choque de la construcción de IA.

El aumento esperado en la infraestructura de IA puede soportar la demanda, pero los inversores deben sopesar los riesgos cuidadosamente.

La exposición geopolítica, las restricciones a la exportación de Estados Unidos y el ritmo de competencia de HBM podrían mover la aguja.

¿Listo para comerciar más allá de las mayores?

Abrir una cuenta · Iniciar sesión

GO Markets
March 20, 2026
Market insights
Technology
Más allá de Nvidia: 5 acciones de IA para ver en 2026

Entonces, aquí está la cosa...

Si ha estado siguiendo la historia tecnológica durante la última década, ha sido capacitado para mirar un parche muy específico, muy pequeño de bienes raíces en el norte de California. Pero como nos sentamos aquí a principios de 2026, el momento de “conectar los puntos” para los inversores es este: el comercio de IA ha dejado de ser sobre demostraciones de software brillantes en Palo Alto y ha comenzado a ser sobre la industrialización física de la computación.

¿Quieres saber más? Lea nuestro manual de jugadas de IA 2026

Qué cambió y por qué es importante

Hemos entrado al “Año de la Prueba”. Se proyecta que las empresas más grandes del mundo, las hiperescaladoras, gastarán la asombrosa cifra de 650 mil millones de dólares en gastos de capital este año. Pero aquí está la parte que la mayoría de la gente extraña: que el dinero no se queda en Silicon Valley. Está fluyendo hacia los jugadores de “picks and palas” en Idaho, Washington, Colorado e incluso en el extranjero.

Si quieres entender dónde puede estar aterrizando el retorno de la inversión (ROI) real en esta temporada de ganancias, tienes que buscar fuera del código de área 650. El cambio de la exageración de la IA a la industrialización de la IA está cambiando el mapa.

The full AI stack: from capex to consulting — GO Markets

Five companies · AI infrastructure play · 2026

The full AI stack: from capex to consulting

Infrastructure builders compared to the implementation bridge across the AI value chain


Note: Hyperscalers shown as 2026 CapEx spend. Accenture shown as cumulative advanced AI bookings ($11.5B through Q1 FY2026), reflecting its role as the adoption layer rather than the infrastructure layer.
Infrastructure (2026 CapEx projected) Implementation bridge (cumulative AI bookings)

Hyperscaler CapEx: Early 2026 analyst estimates, midpoint of ranges. Amazon approx. 100% YoY, Alphabet approx. 100%, Meta approx. 87%, Microsoft approx. 50%.
Accenture: Cumulative advanced AI bookings $11.5B through Q1 FY2026. Q1 AI bookings $2.2B (up 76% YoY), AI revenue $1.1B (up 120% YoY) across 1,300+ clients.

Cinco empresas configuran la siguiente fase de la IA

Micron Technology (MU), Boise, Idaho

Micron es la “columna vertebral de la memoria” del ciclo actual. Mientras todos miraban a los diseñadores de chips, muchos pasaron por alto el hecho de que los chips de IA son mucho menos útiles sin memoria de gran ancho de banda (HBM). Actualmente, Micron es visto por algunos analistas como una compra fuerte porque, según se informa, su capacidad se agotó hasta finales de 2026. Los analistas también están contemplando un salto de 457% en las ganancias por acción (EPS) a medida que el ciclo de memoria alcanza lo que algunos describen como un pico robusto.

Microsoft (MSFT), Redmond, Washington

Microsoft es la columna vertebral empresarial de esta transición. Se ha movido más allá de los simples chatbots y ahora está construyendo lo que los analistas llaman “Fábricas de Inteligencia”. Si bien el stock se ha enfrentado recientemente a presiones por las limitaciones de capacidad, se informa que la demanda subyacente de Azure AI aún está por delante de la capacidad. El caso alero más amplio es que Microsoft se está moviendo hacia “Agentic AI”, sistemas que no solo hablan con los usuarios, sino que también pueden ejecutar flujos de trabajo de negocios de múltiples pasos.

¿Qué empresas asiáticas están apostando a lo grande por la inteligencia artificial?

Amazon (AMZN), Seattle, Washington

Amazon está jugando un juego a largo plazo de integración vertical. Para reducir su dependencia del costoso hardware de terceros, está construyendo sus propios chips de IA internamente. Amazon Web Services (AWS) sigue siendo el principal impulsor de la rentabilidad, y la compañía está utilizando sus datos minoristas para entrenar modelos especializados que muchas empresas emergentes de Silicon Valley pueden tener dificultades para replicar.

Palantir Technologies (PLTR), Denver, Colorado

Si Micron proporciona la memoria y Microsoft la plataforma, Palantir proporciona el “sistema operativo” para la fábrica moderna de IA. La compañía ha registrado un fuerte impulso, con ventas comerciales en Estados Unidos creciendo recientemente 93% año con año. A menudo se enmarca como un puente entre los datos brutos y la rentabilidad corporativa, que sigue siendo un enfoque clave para los inversores en 2026.

Accenture (ACN), Dublín, Irlanda

No se puede simplemente “conectar” la IA. Las empresas a menudo necesitan rediseñar los procesos a su alrededor, y ahí es donde Accenture entra en juego.

La compañía es vista como un puente de implementación, con un analista argumentando que “GenAI necesita Accenture” para pasar de los programas piloto a la producción, aunque el ángulo de precaución es que la historia de IA aún no ha entusiasmado completamente a los inversores aquí porque los ingresos por consultoría pueden tardar más en aparecer que las ventas de chips.

¿Qué podría pasar después?

El gráfico mapea los tres horizontes temporales que probablemente den forma a la siguiente fase del comercio de industrialización de IA.

A corto plazo, los mercados siguen reaccionando a las ganancias de los fabricante de chips, a la orientación y a cualquier signo de tensión en la capacidad. Durante el próximo mes, la atención se desplaza hacia los insumos del mundo real detrás del crecimiento de la IA, especialmente la energía, el financiamiento y la infraestructura. Para la ventana de 60 días, la pregunta clave es si el gasto en IA se está ampliando a una nueva calificación del mercado más amplia o adelantándose a los rendimientos a corto plazo.

A lo largo de los tres períodos, el enfoque es el mismo: la prueba. Los inversores buscan señales de que el gasto de capital de IA se está traduciendo en una demanda real de energía, tierra y capacidad industrial. Es por eso que las actualizaciones de las empresas vinculadas a la energía y la construcción de data centers son más importantes que nunca.

What could happen next — GO Markets

Scenario planning · March 2026

What could happen next

Three time horizons, three scenarios to watch across the AI industrialisation cycle


Next 2 weeks

Chipmaker reports

Possible

Market volatility continues as traders digest the latest reports from chipmakers like Micron

Upside scenario

"Bulletproof" guidance from remaining infrastructure names triggers a sector-wide relief rally

Watch for

Any mention of "capacity constraints" or "supply bottlenecks" in earnings calls

Next 30 days

Energy and rates

Possible

Focus shifts to "real economy" energy players like NextEra that power the data centres

Downside scenario

Rising oil prices from Middle East conflict act as a tax on tech margins, rotating into defensives

Action point

Monitor Fed language on rates. Higher for longer makes $650B capex bills far more expensive to finance

Next 60 days

The great dispersion

Possible

Market rewards companies with real AI revenue and punishes those still stuck in experimentation

Upside scenario

NextEra Energy (NEE) data centre announcements in late April/May trigger a utility renaissance rally

Downside scenario

An "air pocket" in profits occurs where debt-funded investment outpaces revenue gains

Watch

May reports from Texas Pacific Land (TPL) — is data centre land demand still "red hot"?

Action point

Review your portfolio for geographic diversity. The AI story is now a global power race

La trampa psicológica

La trampa emocional en la que caen muchos comerciantes en este momento es el sesgo reciente. Has visto ganar a NVIDIA y al “Magnificent 7" durante tanto tiempo que parece que son la única forma de jugar a esto. Pero el comercio “obvio” es a menudo el que ya se ha cotizado. Antes de actuar, pregúntese: “¿Estoy comprando esta acción porque entiendo su papel en la cadena de suministro física de IA, o porque tengo miedo de perderme la siguiente etapa de un rally que comenzó hace dos años?”

¿Listo para comerciar más allá de las mayores?
Abrir una cuenta · Iniciar sesión

Descargo de responsabilidad: Este contenido es solo de información general y no debe ser utilizado como asesoramiento financiero personal o una recomendación para comprar, vender o mantener cualquier producto financiero. Las referencias a empresas o temas, incluidas las acciones relacionadas con la IA, son solo ilustrativas. Los mercados de acciones y derivados pueden moverse bruscamente, y sectores concentrados como IA y tecnología pueden experimentar una volatilidad elevada, riesgo de valoración y riesgo de liquidez. Si negocia derivados como CFDs, el apalancamiento puede magnificar tanto las ganancias como las pérdidas. El performance pasado no es un indicador confiable del desempeño futuro.

GO Markets
March 19, 2026

Aviso legal

Las referencias a empresas, candidatas a IPO, valoraciones, bolsas, sectores y mercados son solo ilustrativas, se basan en información disponible públicamente al momento de publicación y pueden cambiar sin previo aviso. Una cotización propuesta puede retrasarse, modificarse o cancelarse, y su inclusión en esta página no implica que una empresa vaya a cotizar, ni que alguna acción o CFD esté disponible para operar a través de GO Markets.