
市场资讯及洞察

5 月伊始,联邦基金目标利率区间维持在 3.50% 至 3.75%。美联储刚刚结束了 4 月 28-29 日的议息会议,投资者正进入一个政策真空期,直至 6 月 16-17 日的下一次决议。然而,地缘政治背景远非平静。由于伊朗冲突导致霍尔木兹海峡处于事实上的关闭状态,布伦特原油价格已飙升至每桶 108 美元附近,国际能源署将其描述为“史上最大的能源供应冲击”。
本月的宏观矛盾既直接又令人不安:由能源驱动的通胀脉冲,正撞上 3 月份表现意外强劲的劳动力市场,而第一季度的增长数据却依然疲软。这种带有“滞胀”色彩的组合拳,直接挑战了美联储目前的政策路径。
美联储此前已将 2026 年 PCE 通胀预期上调至 2.7%,并继续暗示年内仅有一次降息,尽管市场对具体的降息时点仍持有异议。由于 5 月没有 FOMC 议息会议,每一项重磅数据的发布都将比往常承载更多的权重,成为投资者博弈 6 月政策走向的关键筹码。
经济增长:业务活动与需求
步入 5 月,经济增长的前景表现不一。第一季度 GDP 初步预览值已于 4 月 30 日公布,而此前疲软的零售销售和库存数据,使得整体需求端的局势变得更加难以捉摸。
ISM 制造业指数一直是乐观情绪的一个低调来源,近期的数值始终维持在扩张区间。然而,逆风的来源正在发生变化:能源成本和关税效应目前是决定业务活动下一步走向的最关键变量。对于那些已经在应对高昂投入成本的企业来说,108 美元的油价与贸易摩擦的结合,将是对企业韧性的一次重大考验。
劳动力:非农与就业数据
4 月的就业形势报告是本月最集中的风险事件之一。尽管 3 月非农数据强于预期,但此前的修正值使得整体趋势显得有些模糊。4 月的数据将起到决定性作用:揭示劳动力市场是在高利率背景下真正实现了“再加速”,还是仅仅在消化季节性噪音。
通胀:CPI、PPI 与 PCE
4 月的通胀数据是本月对市场影响最大的板块。3 月消费者价格指数 (CPI) 同比上涨 3.3%,其中能源成本月度上涨 10.9%,汽油价格飙升 21.2%,贡献了整体涨幅的近四分之三。鉴于布伦特原油在 4 月下旬维持在 105 至 108 美元之间,能源成本进一步传导至 4 月 CPI 几乎已成定局。尽管整体通胀数据引人注目,但核心 CPI 和核心 PCE 依然是研判美联储底层通胀趋势的关键指标。
政策、贸易与企业盈利
由于 5 月没有 FOMC 议息会议,政策关注点将转向美联储官员的讲话以及备受瞩目的领导层更迭。美联储主席杰罗姆·鲍威尔的任期将于本月中旬结束。唐纳德·特朗普总统已提名 凯文·沃什 (Kevin Warsh) 为下一任主席,市场正密切分析其听证会内容,以寻找央行独立性或政策倾向是否会发生转向的蛛丝马迹。
在地缘政治方面,已进入第九周的伊朗冲突仍是最大的宏观尾部风险。霍尔木兹海峡的封锁和停滞不前的美伊谈判为能源价格设定了较高的底部支撑。同时,第一季度财报季进入高峰期,预计 5 月 7 日将是报表发布最密集的一天,市场将重点关注零售和周期性行业如何应对利润率的挤压。
本月核心监控清单
- 美伊谈判: 关注霍尔木兹海峡运行状态的任何进展。
- 美联储语调: 官员在会议间隙期辞令的任何细微转变。
- 盈利质量: 尤其是零售、能源及周期性行业的表现。
- EIA 原油库存: 通过周度数据衡量国内供应缓冲情况。
- 关税公告: 任何可能推高通胀预期的贸易摩擦信号。
核心总结 (Bottom Line)
绝不能因为 5 月没有议息会议就认为这是一个平淡的月份。在 6 月决议之前,非农、CPI、PPI 和 PCE 数据将悉数出炉,而原油依然是主要的外源性冲击。对于市场而言,核心问题在于:我们面对的是一次暂时的能源驱动型通胀上升,还是在增长放缓的同时出现了一个更广泛的系统性通胀问题?这一区别将决定债券、美元、黄金及股指的下一个大级别走势。

Equity markets US stocks jumped overnight to reach record levels as stronger than expected print on retail sales and a sharp improvement in the number of new jobless claims cheered the investors. Source: Yahoo Finance US reporting season kicked off this week with impressive results so far from Finance heavyweights JP Morgan, Goldman, BOA and Citi, all handily beating estimates. The week's economic figures, strong corporate earnings and comments from Fed Chairman Powell regarding the commitment of the central bank's easy money policies have seen US markets make all time highs on an almost daily basis.
European stocks also hit record highs this week with the EUROSTOXX 50 breaking 4000 and having rallied nearly 80% from the pandemic lows in March 2020. Analysts are confident there is further upside in Europe as prices remain low compared to the U.S and vaccination rates climb to catch up to the U.S. “European equities are set to benefit from a sharp acceleration in euro area GDP (gross domestic product) growth over the coming months, but that is due to the boost from reopening and the support from a powerful U.S. recovery, rather than a function of the dispersal of NGEU funds,” two analysts at Bank of America said in a note to clients. World equity indices are mostly up for the week with only Asian indices lagging.
Traders will be watching today's upcoming Chinese figures, including the all-important GDP figure, which is expected to be the highest quarterly economic growth since it began releasing such figures 30 years ago. Source: Bloomberg Forex markets The US dollar weakened dramatically during the week, under performing all major currencies bar the Canadian dollar. Despite a strong week in Oil, current COVID lock down measures in Canada are causing a headwind for the Loonie.
Source: Bloomberg The recent run up in the US dollar index in tandem with rising 10 year bond yields has reversed in April as yields stabilise and are starting to decline. Overnight 10 year Treasury yields dropped to 1.57%, its lowest level in a month. Source: Bloomberg Source: GO MT4 Commodities Gold Spot gold (XAUUSD) rallied this week on the back of a weaker US dollar.
US CPI figures also came in higher than expected this week, giving gold an extra boost as it is seen as a traditional inflation hedge. Source: GO MT4 Oil US crude prices rallied strongly this week on continued expectation of a global economic recovery. Agreed production cuts have also given Oil a boost as OPEC is holding back just over 7 million barrels per day, with Saudi Arabia voluntarily cutting an additional 1 million barrels per day.
From next month OPEC+ will start gradually curbing production cuts. In May OPEC+ will allow an additional 350,000 barrels per day to join the markets. Source: GO MT4 Bitcoin The highly anticipated Coin base (COIN) IPO launched this week, with investors piling into the new stock.
This mainstreaming of cryptocurrencies in general and Bitcoin in particular saw strong buying in Bitcoin pushing it through the 60k resistance level and hitting all time highs just short of $65k USD. Source: GO MT4 Monday, 19 April 2021 Indicative Index Dividends Dividends are in Points ASX200 WS30 US500 US2000 NDX100 CAC40 STOXX50 0 0 0 0.005 0 2.808 1.234 ESP35 ITA40 FTSE100 DAX30 HK50 JP225 INDIA50 0 79.017 0 0 0 0 0

The market closed the week down overall as volatility continues due to the Russia and Ukraine conflict. The Dow Jones dipped 0.5%, the S&P500 fell 0.8%, and the NASDAQ performed the worst, declining 1.7%, despite generally positive sentiment from the USA concerning the employment figures released on Friday. Employers added 678,000 jobs to the workforce in February, and unemployment was lowered to 3.8% beating most analysts' expectations.
CPI figures will be on the agenda next week as inflation continues to garner attention. European stocks were hit the hardest, with the DAX losing more than 10% over the week and 4.41% on Friday, as it continues to be hit hard by the conflict. The FTSE also had a tough week and closed Friday down 3.48%.
Commodities had a belter week and got close to their largest rise in prices since 1960. European natural gas more than doubled in price, wheat soared 40%, and oil increased 20%. These increases may have an impact on the energy and commodity sector in the Australian market going forward.
The surge in energy prices has occurred despite economic sanctions that have not targeted Russia’s energy exports. Gold finished the week exceptionally strong, closing at the upper end of the weekly range towards $1,970. The price continues to provide a haven for investors as the volatility remains.
Oil followed its strong closing towards the high of the week at $117.96. Cryptocurrency Bitcoin had shown strength earlier in the week, but it could not hold its highs around $45,000 BTC/USD. It closed the week below $40,000.
Ethereum followed a similar pattern falling to $2,593. FOREX The EUR/USD had a massive drop falling -1.23%. The Euro struggled against all of the currency pairs, recording big drops for the week.
The GBP also was a weak performer for the week. Due to their geographical exposure, the EUR and GBP have been the most sensitive to news from the conflict. The AUD and NZD performed well for the week and have seen a nice move into recent resistance.

Adobe Inc. (ADBE) announced its latest earnings results after the closing bell on Thursday for its second quarter fiscal year 2022 ended June 3. The American software company reported revenue of $4.386 billion for the quarter (up 14% year-over-year), beating analyst forecast of $4.345 billion. Earnings per share also reported above analyst expectations at $3.35 per share vs. $3.31 per share estimate. ''Adobe achieved record Q2 revenue with strong demand across Creative Cloud, Document Cloud and Experience Cloud,'' Shantanu Narayen, chairman and CEO of Adobe said following the latest financial results. ''We are winning in our established businesses and seeing significant momentum in new categories from content authoring for a broad base of creators to PDF functionality on the web to the leading real-time customer data platform for global enterprises,'' Narayen concluded. ''We delivered another quarter of strong financial results, with greater than $2 billion in operating cash flows demonstrating the strength of Adobe’s growing revenue streams and financial discipline,'' said Dan Durn, executive vice president and CFO of Adobe. ''Our operating model continues to fuel consistent growth, enabling the company to invest in category-leading cloud solutions and emerging innovations that are gaining traction in the marketplace,'' Durn added.
Adobe Inc. (ADBE) chart Share price of Adobe was down by around 2% at the market open on Friday, trading at $357.37 per share. Here is how the stock has performed in the past year: 1 Month -10.80% 3 Month -21.47% Year-to-date -37.22% 1 Year -37.06% Adobe price targets UBS $415 Stifel $500 Baird $450 Deutsche Bank $500 Wells Fargo $425 Mizuho $480 Citigroup $380 Adobe is the 59 th largest company in the world with a market cap of $167.63 billion. You can trade Adobe Inc. (ADBE) and many other stocks from the NYSE, NASDAQ, HKEX and the ASX with GO Markets as a Share CFD.
Sources: Adobe Inc., TradingView, MarketWatch, Benzinga, CompaniesMarketCap
Accenture (ACN) reported its latest financial results before the market open in the US on Thursday. The Irish-American professional services company reported revenue of $16.159 billion for the third quarter of fiscal 2022 vs. $16.04 billion expected. Earnings per share missed analyst expectations for the quarter at $2.79 per share vs. $2.86 per share estimate. ''Our very strong financial results for the third quarter reflect continued broad-based demand across markets, services, and industries, and the continued recognition of the outstanding talent of our 710,000 people.
We continue to gain significant market share, and our services have never been more relevant as our clients turn to us as the trusted partner for the solutions they need to accelerate growth and become more resilient and efficient,'' Julie Sweet, CEO of the company said in a press release after the earnings announcement. Accenture (ACN) chart Shares of Accenture were down by around 1% during the trading day on Thursday at $282.45 per share. Here is how the stock has performed in the past year: 1 Month -3.00% 3 Month -13.07% Year-to-date -31.78% 1 Year -3.01% Accenture price targets Deutsche Bank $364 Cowen & Co. $330 Baird $340 Morgan Stanley $390 RBC Capital $435 Goldman Sachs $386 Barclays $455 Accenture is the 52 nd largest company in the world with a market cap of $179.21 billion.
You can trade Accenture (ACN) and many other stocks from the NYSE, NASDAQ, HKEX and the ASX with GO Markets as a Share CFD. Sources: Accenture, TradingView, MarketWatch, Benzinga, CompaniesMarketCap
November 2021, cryptos are regularly making all-time highs amid a mania like euphoria that increased institutional uptake and a newly launched ETF that crypto traders believed would drive prices even higher towards some of the uber bulls loftier 2021 targets. Two months is a long time in the crypto world and they have lived up to their volatile reputation with the two largest tokens (BTC and ETH) having lost almost half of their value since then. The broader crypto sector has also suffered with more than $1 trillion in losses amid an accelerating panic that the expected Federal reserve tightening cycle will lead to another deep crypto correction.
The question crypto traders are asking is “where to from here?”, is this the start of a deep correction, or an opportunity to Buy the dip? Source: Tradingview While the selling has been relentless since November, it picked up pace after the Federal reserve released their latest minutes in early January. The hawkish tone of the Fed, where it outlined its intention to not only hike rates but to accelerate the tapering of its asset purchase program, saw a broad sell-off of the riskier “bubble” assets, with bitcoin getting hit especially hard amid the rout.
This rapid decline has pushed Bitcoin’s RSI indicator to an extreme oversold level, a level not seen since the pandemic crash of March of 2020. Source: Tradingview Also bringing the price down to within touching distance of the all important, major support level of around 30k USD per token, a support that held previous sell offs in 2021. Source: GO MT4 While these technical may give confidence to the bulls that a bounce is due, there is one interesting fact that has become apparent in the last 12 months.
Cryptos have increasingly transformed from relatively uncorrelated assets providing diversification during market turbulence, into what is effectively a high beta stock. The increasing BTC correlation with high growth tech stocks means that not only do traders need to take Bitcoin fundamentals and technicals into account, but also the fundamentals/technicals of the high growth tech sector as well, the chart below shows this BTC correlation with the FAANG basket (Facebook, Amazon, Apple, Netflix and Google) Source: Tradingview One of the main reasons for this correlation is the increase in institutional adoption of cryptos, the same institutions that are now facing margin calls on their tech holdings, are also dumping cryptos to provide much needed liquidity. Antoni Trenchev,, co-founder of Nexo, cites Bitcoin’s correlation to the tech-heavy Nasdaq 100, which right now is near the highest in a decade. “Bitcoin is being battered by a wave of risk-off sentiment.
For further cues, keep an eye on traditional markets,” he said. “Fear and unease among investors is palpable.” The evidence is growing that Bitcoin and altcoins should be classed as risk assets rather than safe havens. Along with fears of central bank tightening and an increasing liquidation of correlated risk assets, crypto also has had to deal with a relentlessly pessimistic news cycle. Recently regulators from Spain, the U.K., Russia and Singapore all announced regulations and interventions that could undermine crypto uptake and growth in those regions.
Out of the US as well, cryptos are under scrutiny with federal agencies tasked with assessing the risks and opportunities that cryptos pose in a report due as early as February. It's not all doom and gloom with cryptos though, crypto bulls and many analysts point out that on all previous occasions of crypto carnage, they eventually rebounded to new all time highs. “At some point, sellers will become exhausted and the market could see some capitulation soon”, said Matt Maley, chief market strategist for Miller Tabak + Co. “When that happens, the institutions will come back in in a meaningful way,” he said. “ Once the asset class becomes more washed-out, they’ll have a lot more confidence to come back in and buy them. They know that cryptos are not going away, so they’ll have to move back into them before long.” Ironically, the real support could come from the Federal reserve as they realise that hawkish tone they have set may be to much for an economy that is slowing and could pivot to the dovish side in this week's FOMC meeting, a pivot which would be expected to send risk assets sharply higher, cryptos with it. “If we see a bigger selloff in equities, expect the Fed to verbally intervene to calm nerves and that’s when Bitcoin and other cryptos will bounce.” Said Nexo's Trenchev.
This effect could be seen in Mondays (24/01) huge turn around in equities and Bitcoin, bitcoin soared $3000 from its low to finish positive for the session, this was on the back of rate hike expectations dropping dramatically during the day as the market started to price in a backed into a corner Fed striking a more dovish tone than previously expected in Thursdays FOMC meeting as the below chart shows. Source: Tradingview Thursday's Fed meeting will be pivotal for the near term direction of Bitcoin and Cryptos in general, and any serious crypto trader should be tuning in. 2022 will be an exciting year for cryptos, with strong forces on both sides of the bull / bear argument. The bears have a seemingly endless negative news cycle, with regulatory and market risk weighing heavily on crypto prices.
The bulls have the Fed, a Fed that has shown in the past that the faster markets crash, the faster they panic and move to stabilise the stock market, this will also benefit other risk assets, Bitcoin and other cryptos among them. Whichever side a trader picks, they will have to be nimble and be across the fundamentals and technicals of the broader market, not just the crypto chart they are looking at.

热门话题
一年一度的dota2国际邀请赛将要召开啦。Dota2国际邀请赛也俗称TI,之前已经召开了10次比赛而这一次的就是TI 11.这次举办的地址选在了新加坡,这是电竞界的最高盛事首次来到东南亚。这将是迄今为止连续四个周末的Dota 赛事,共有来自世界各地的30 支队伍参加,这也将是迄今为止最大的Dota 赛事。
Dota 2是由Valve在2013年开发和发行的多人在线战斗竞技场(MOBA)视频游戏。该游戏是远古防御( Defense of the Ancients )的续集,DOTA是暴雪娱乐的《魔兽争霸III:混沌之治》社区创建的模组。Dota 2是在两由五名玩家组成的队伍之间进行的比赛,每支队伍在地图上占领和保卫自己的独立基地。十名玩家中的每一位都独立控制一个强大的角色,称为“英雄”,他们都拥有独特的能力和不同的游戏风格。在比赛期间玩家收集经验值 以及进行物品的购买,为了可以击杀对方团队的英雄。一个团队首先摧毁了另一个团队的“古代遗迹”,这是一个位于队伍己方基地,一旦基地遗迹被摧毁,那么摧毁方就会赢得比赛。因此,在这样的规则下,就让Dota2的比赛充满着许多的不确定性,无论击杀对方英雄多少次,一旦遗迹被摧毁,还是会输掉比赛。所以,DOta2的游戏魅力应运而生,那就是有无限的可能性,有时候一个小小的失误也可能葬送掉比赛。不过就是dota2的学习周期太长和上手难度高,导致游戏新鲜血液也越来越少。在今年8月分开始出售新加坡Ti11的比赛门票,但是在短短的15秒钟,门票就被黄牛抢购一空,作为想买门票的doter,不禁也感叹,黄牛真厉害。

不过,我们今天就来讲一讲从dota2国际邀请赛购票衍生出的黄牛经济学。黄牛一词的出现,是来源于20世纪的上海,在当时,票贩子进行抢票的的时候都是跑得快,挤的厉害,人们就称其“似黄牛之群骚动”。那么这个词真正开始推广的原因是之前的春运。春运期间,无数的人返现家,那么春运票就出现了供不应求的一个情况,而且因为政策的限制,票价不可能持续上涨。在这种情况下,黄牛就看准了这个机会,提前购入大量票,然后以高价把票卖出去,以此来牟利。纵观历史,黄牛实际上一直都存在于我们的社会生活当中。各个地方的叫法不同,有叫倒爷的,有叫黄牛的。然而他们都是同一类人。随着时代的改变,黄牛的倒卖范围也在不断的增加,从之前的演唱会票,到后来的Dota2 Ti 票,新上市的电子产品,甚至医院的挂号。大部分人把黄牛归结为管制的不够完善,而实际上,其中也存在的底层的经济学逻辑,让黄牛这一职业存活了下来,甚至到这些年,存活的也越来越好。
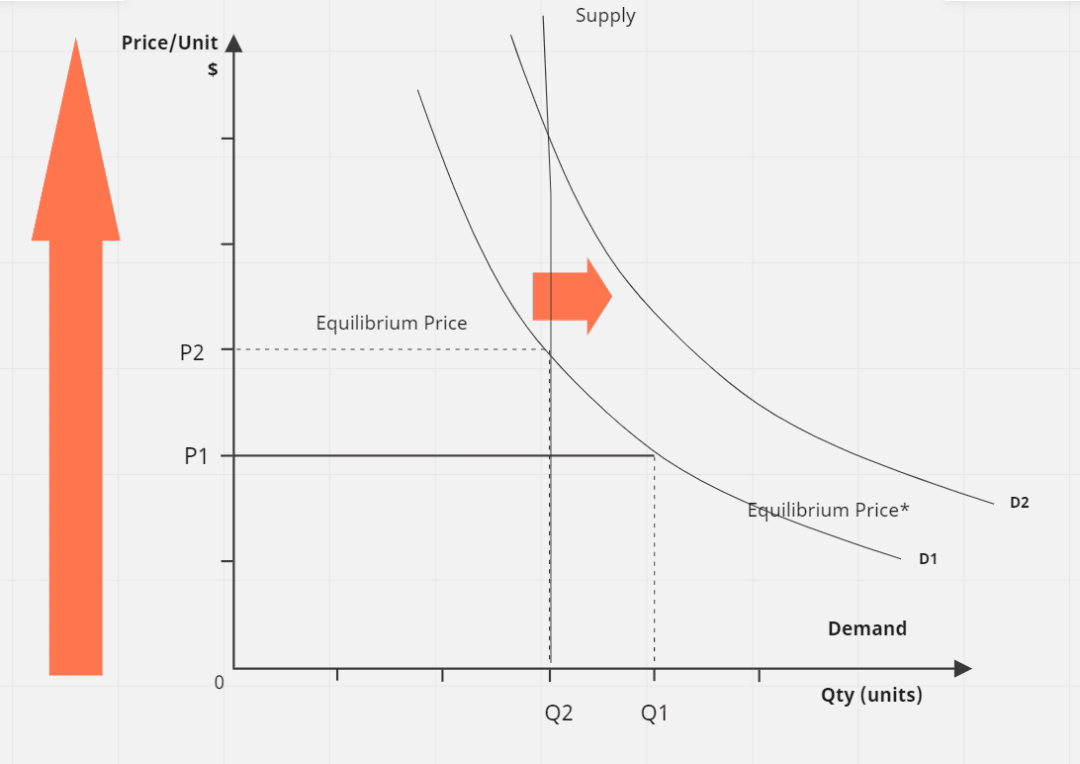
首先,最大的问题就是供不应求和价格的控制。对于这些情况,实际上就存在一个供不应求的关系。每年或者每个时间段有的供给是一个固定的数量(图中的S),但是在需求端是在逐渐上升的(D1-D2)。那么就造成供求曲线不存在任何的弹性。同时,在价格严格控制的同时,原本可以通过涨价使得需求降低的情况也不存在。这时候,黄牛的就应运而生,黄牛通过牟利,赚取差价,让票价上市(P1-P2),从而需求降低(Q1-Q2)。从某种意义上来说,黄牛“创造”了一个二级市场,然后通过自定义价格去使得供需达到一个罕见的平衡。当然,这个自定义的票价也不是随便去定义的,而是符合市场需求环境去定价。只要一天供给达不到平衡,价格继续被控制住,黄牛就会继续牟利。
以这次Ti门票为例,实际上,对于决赛的门票一定需求大于供给的,那么黄牛看准这个机会,先抢到这个票,把价格提上来,最后卖出去牟利,而黄牛也知道,决赛门票只要不是贵的离谱,近期是不会出现滞销的,因此,很多人成为的抢不到票的倒霉蛋。进而大概率只能去购买高价的黄牛票。其次,就是定价的公平性。实际上很多东西的定价对于不同人群是不同的。举个例子,抢购某个新产品,会员价格是5000,非会员价格是7000.那么这样的情况就会自然而然的产生差价,要么我就成为会员,要么就是找有会员的人买。当然,有会员的人出售的时候,大部分都不会以5000的原价出售。因为我费时费力的抢购,但是又不会以7000的非会员价出售,这时候可能6000就是一个合理价格,那么就可以达成双方都开心的局面。没需求的会员赚了1000,有需求的非会员节省了1000元。当然,这并不能改变黄牛在我们心中的地位。最主要的原因就是,黄牛打破了一个最基本的原则。公平。因为无论是我们抢票还是买东西,只要我们有足够的资金,都有权去购买想要的产品,这就是有着同样机会的公平性。就像但是黄牛通过自身的手段,使我们失去了这种机会和权力的公平性。其次就是使得供求双方的权利受损的可能性非常大。因为其使得供需双方不能直接交易,那么很容易出现就是分配不公平的现象。最简单的例子就是,黄牛价格太狠,导致演唱会门票滞销,想看演唱会的人看不到,辛辛苦苦准备的歌手等主办方努力付诸东流。然后就是,黄牛中不可避免的存在有欺诈的存在,导致供需双方利益进一步受损。免责声明:GO Markets分析师或外部发言人提供的信息基于其独立分析或个人经验。所表达的观点或交易风格仅代表其个人;并不代表GO Markets的观点或立场。联系方式:墨尔本 03 8658 0603悉尼 02 9188 0418中国地区(中文) 400 120 8537中国地区(英文) +248 4 671 903作者:Neo Yuan | GO Markets 助理分析师